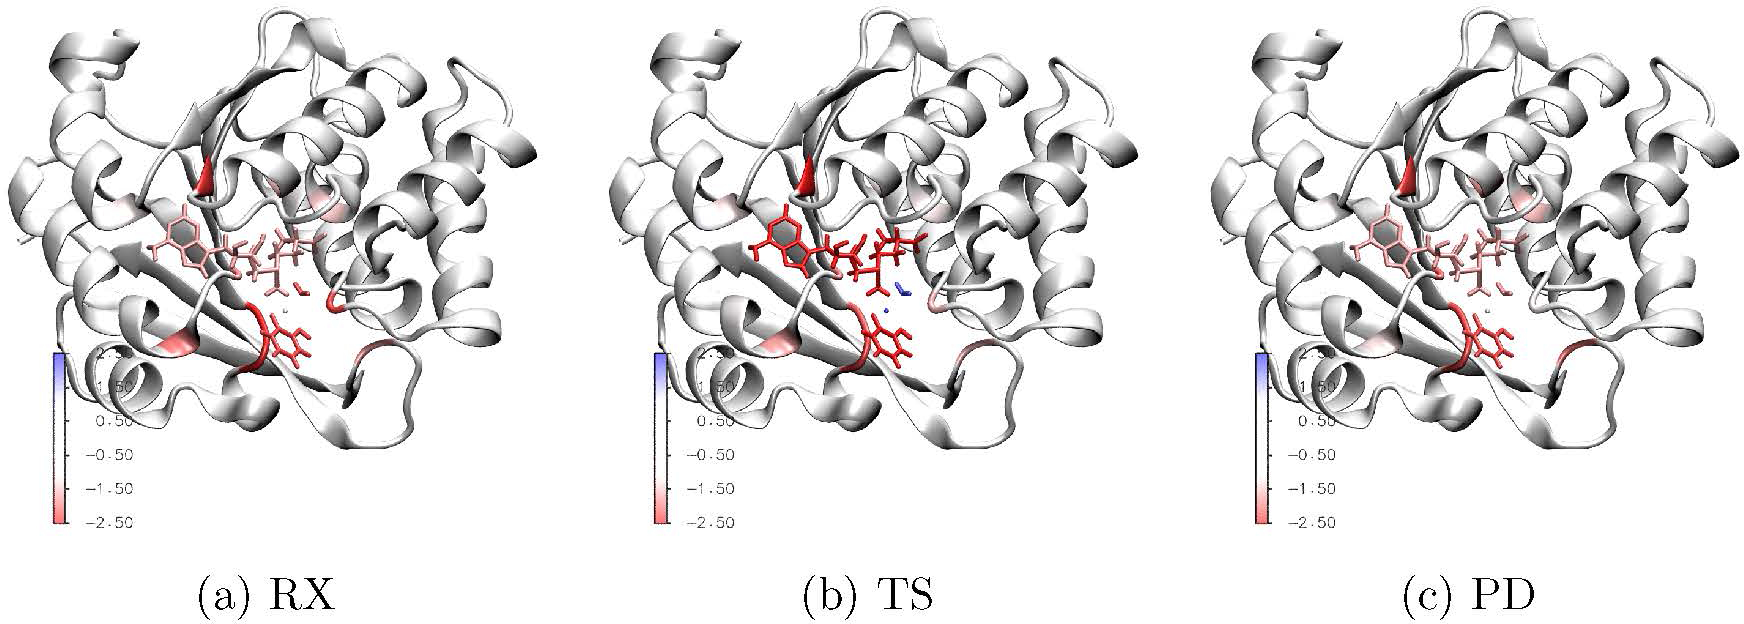
Figure 7:

Max Covariance at the DFTB3/MM level (×105 for visual clarity) between any residue to those in the M2 region computed for M5+D3 mapped onto the protein structure; for results for the M5C+D3 model, see Fig. S20 in the Supporting Information.
