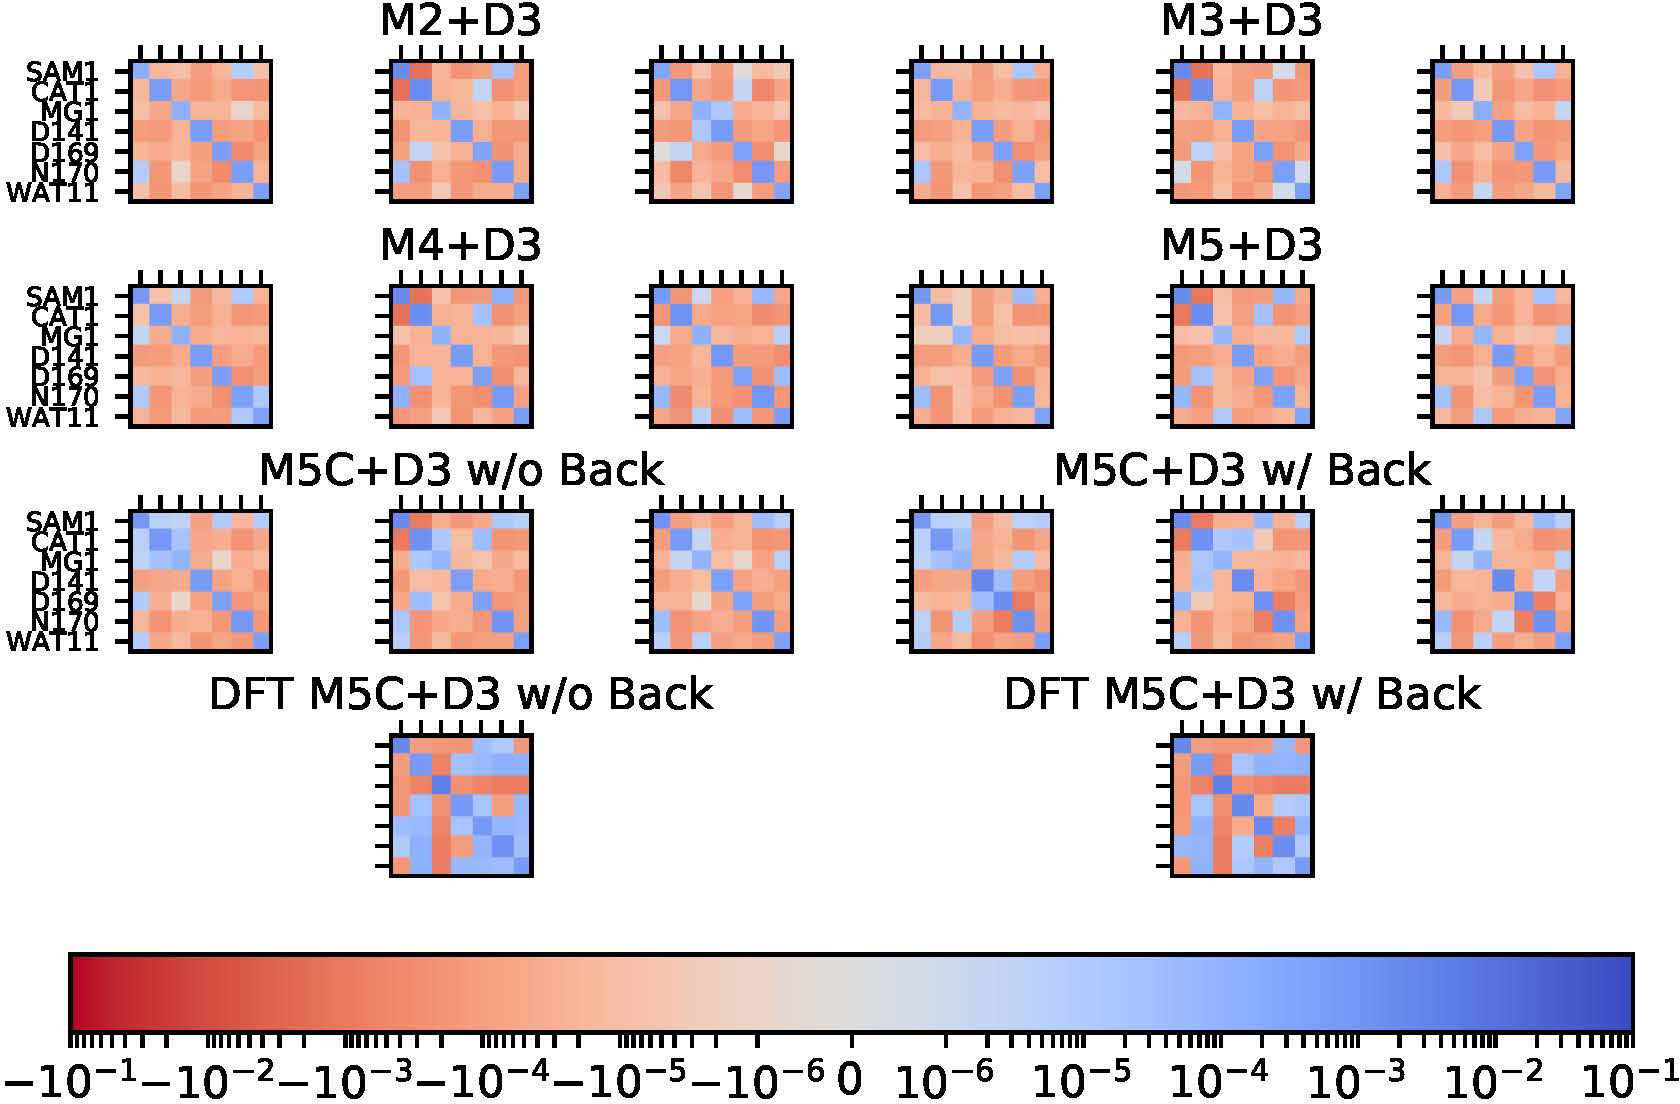
Figure 8:

Charge covariance matrices at the DFTB3/MM level for the M2 region from different QM/MM simulations that include empirical dispersion; for each model, results for the reactant, transition state and product are shown separately. For the M5C+D3 model, charges are reported for each residue with those for the backbone atoms either included (‘w/Back’) or excluded (‘w/o Back’). Results for QM/MM simulations without the empirical dispersions are overall similar and thus not shown. For comparison, the last row shows the CM5 charges from DFT (ωPBEh/def2-SVP)/MM calculations using DFTB3/MM snapshots for the reactant state.
