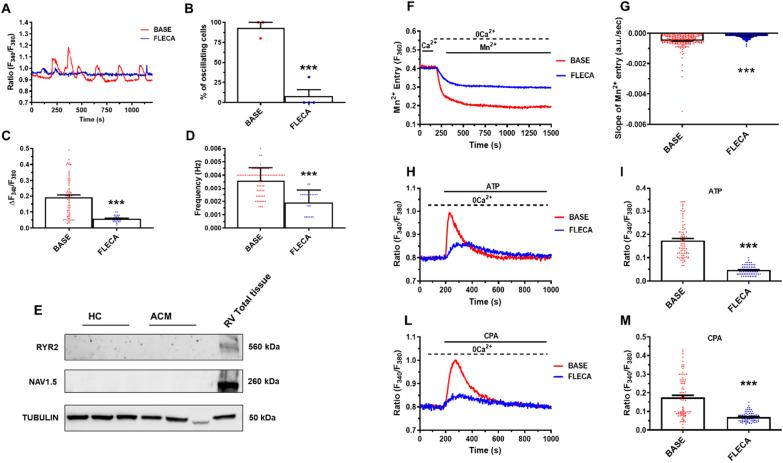
Fig. 4.
Flecainide inhibits spontaneous Ca2+ oscillations in ACM C-MSC release by inhibiting constitutive SOCE. A Representative Ca2+ traces in C-MSC from ACM patients loaded with Fura-2/AM. The measurements were performed on unstimulated cells cultured in GM in absence (BASE) or presence of flecainide (FLECA, 10 μM). B–D The graphs represent respectively: B percentage of oscillating cells (n = 76 cells BASE vs. FLECA n = 199 cells; Two-tailed Student’s t-tests); C oscillation amplitude (n = 76 cells BASE vs. FLECA n = 22/199 cells; Two-tailed Student’s t-tests) and D oscillation frequency (n = 76 cells BASE vs. FLECA n = 22/199 cells; Two-tailed Student’s t-tests). E Representative images of WB analysis of proteins extracted from HC and ACM C-MSC cultured in GM, hybridized with anti-RYR2 and anti-NAV1.5 antibodies. Immunostaining of the housekeeping Tubulin are shown for normalization. RV total lysate is loaded as positive control (n = 8 biological replicates). F Representative tracings of resting Ca2+ entry in C-MSC from ACM patients evaluated by using the Mn2+-quenching technique. The measurements were performed on cells cultured in GM in the absence (BASE) or presence of flecainide (FLECA, 10 μM, 30 min). G Basal rate of Fura-2/AM quenching in unstimulated or treated C-MSC (n = 280 cells BASE vs. n = 290 cells FLECA; Two-tailed Student’s t-tests). H Representative tracings of intracellular Ca2+ release evoked by ATP (100 µM) in the absence (BASE) and in the presence of flecainide (Fleca, 10 μM, 30 min). I Peak amplitude of ATP-evoked ER Ca2+ mobilization in the absence (BASE) and in the presence of flecainide (n = 76 cells BASE vs. n = 65/97 cells FLECA; Two-tailed Student’s t-tests). L Representative tracings of intracellular Ca2+ release evoked by CPA (30 µM) in the absence (BASE) and in the presence of flecainide (FLECA, 10 μM, 30 min). M Peak amplitude of CPA-evoked ER Ca2+ mobilization in the absence (BASE) and in the presence of flecainide (n = 86 cells BASE vs. n = 80/115 cells FLECA; Two-tailed Student’s t-tests). Data information: mean ± SEM. ***P < 0.001

