Fig. 5.
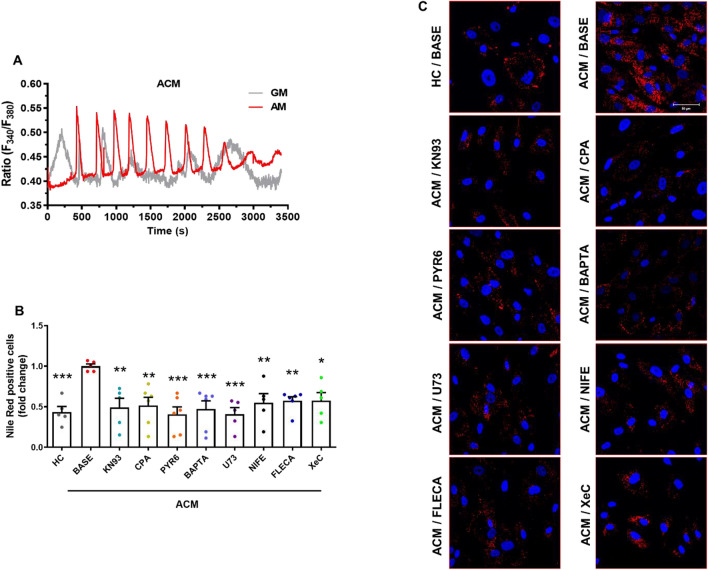
Ca2+ oscillations and CaMKII mediate ACM C-MSC adipogenic differentiation. A Representative Ca2+ traces in C-MSC from ACM patients loaded with Fura-2/AM. The measurements were performed on unstimulated cells cultured in GM or AM for 3 days. B Results of a FACS analysis of ACM C-MSC cultured in AM for 3 days supplemented or not with CaMKII inhibitor or [Ca2+]i modulators (KN93, CPA, PYR6, BAPTA, U73, NIFE, FLECA 10 μM and XeC 1 μM; 3 days), and HC C-MSC, marked with Nile red. The mean fluorescence of Nile Red positive cells is shown for each condition relative to the values of basal level of ACM C-MSC in AM (BASE) (n = 5 biological replicates; one-way ANOVA test). C Representative images of Nile Red staining of ACM C-MSC cultured in AM for 3 days supplemented or not with [Ca2+]i modulators or CaMKII inhibitor, and HC C-MSC. Nuclei are stained with Hoechst 33,342. Magnification is 40X and the scale bar indicates 50 μm. Data information: mean ± SEM. *P < 0.05, **P < 0.01 and ***P < 0.001

