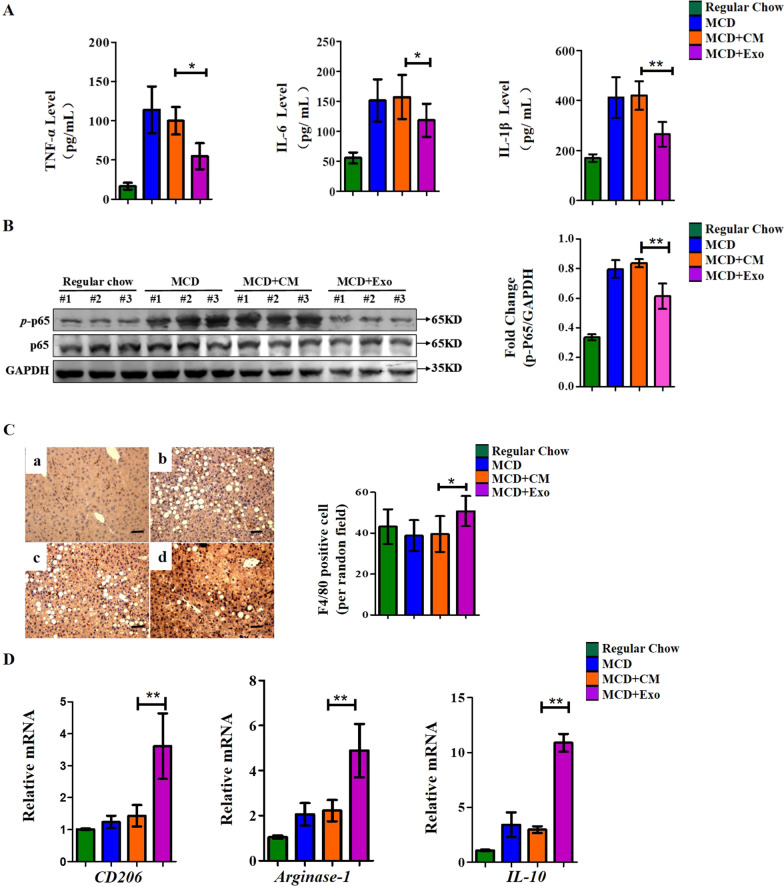
Fig. 3.
A Plasma levels of TNF-α, IL-6, and IL-1β in groups of mice, n = 6. Protein levels were evaluated using the sandwich ELISA method. *p < 0.05. B. Western blotting analysis of phosphorylated NF-κB (p-P65) and total NF-κB (P65) in liver tissues in groups of mice (left panel). Three liver tissues were randomly selected from each group to compare NF-κB activation levels. GAPDH protein levels were used as a reference standard. The phosphorylated NF-κB protein was been quantified using ImageJ software and represented by histogram (fold change of phosphorylated NF-κB /GAPDH, right panel). Full-length blots are presented in Additional file 1: Fig. S2. C. Immunohistochemical assay targeting F4/80 was used to detect macrophages in groups of mouse livers. (a) Regular chow; (b) MCD group; (c) MCD with control medium (CM) extract intervention group; (d) MCD with hUC-MSC exosomes (Ex) group (left panel). Scale bar = 50 μm. Three fields were randomly selected to determine the number of macrophages in the livers of mice in each group, and the differences among groups were compared (right panel). *p < 0.05. D. Quantitative PCR results showing the endogenous mRNA levels of CD206, Arginase-1, and IL-10 in mouse livers in each group (n = 3). GAPDH mRNA served as reference standard. The fold change is shown by the histogram. **p < 0.01

