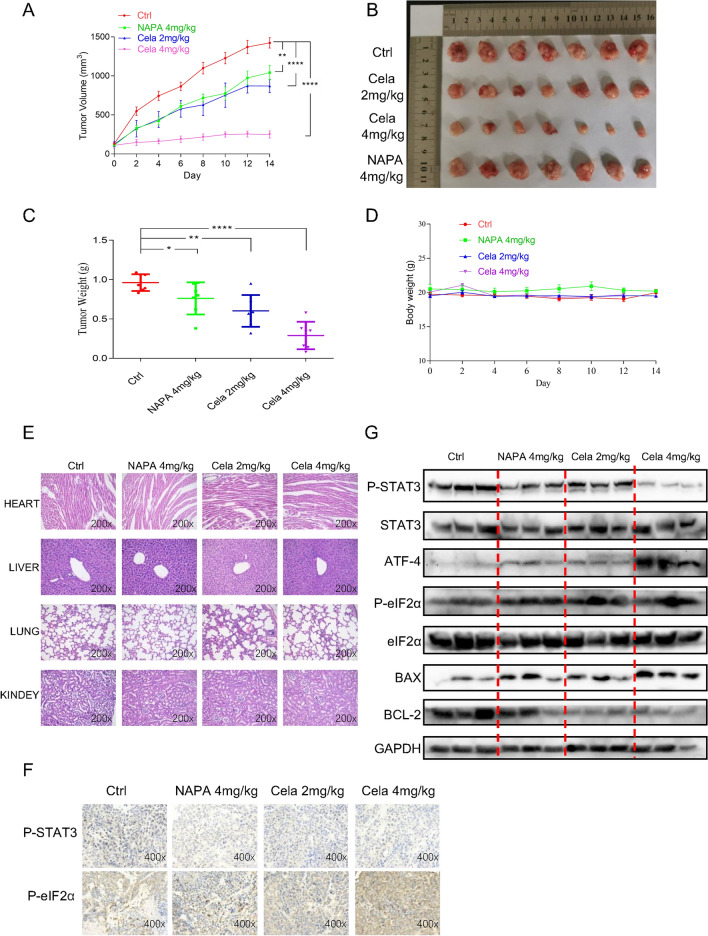
Fig. 6.
The therapeutic action of celastrol in vivo. A Tumor volumes. B Representative figures of the tumor tissue in the celastrol-administered and control groups (n = 7). C Measurement of tumor weights. D Body weight of mice. E Hematoxylin and eosin staining of hearts, livers, lungs, and kidneys from nude mice at 200× magnification. F The expression of P-STAT3 and P-EIF2α was detected by IHC in tumor tissues. G Representative blots indicating the expressions of P-STAT3, ATF4, P-eIF2α BAX, BCL-2, STAT3, eIF2α, and GAPDH in tumor tissues. The images shown are representative of three separate experiments (**P < 0.01, ***P < 0.001, ****P < 0.0001)

