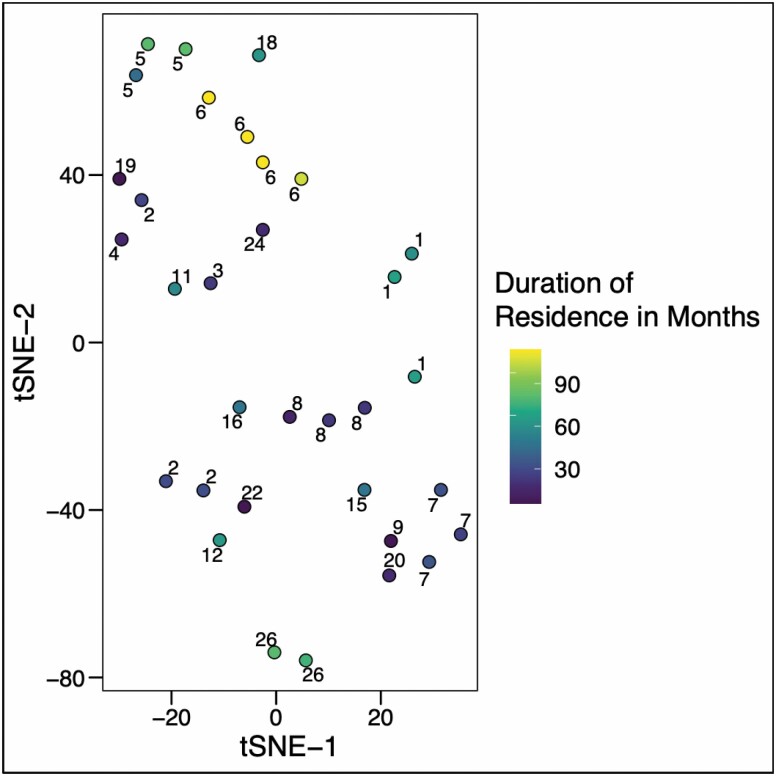
Figure 1.
Bray-Curtis dissimilarity distance between samples plotted by t-distributed stochastic neighbor embedding (tSNE). Numbers associated with individual points denote the study participant that the sample was obtained from. Points are color-coded according to the duration the participant had resided in the nursing home.

