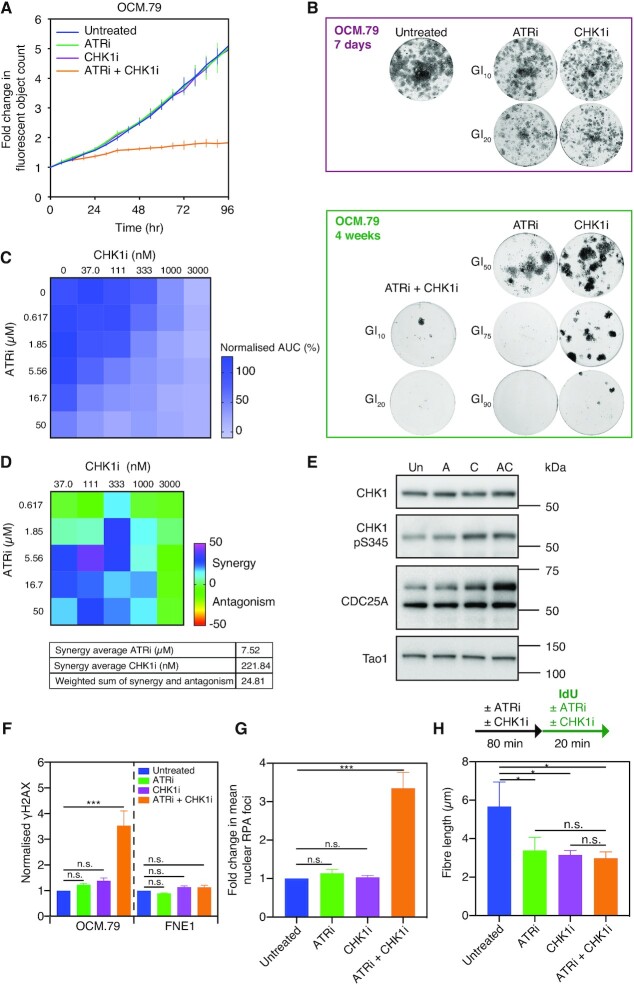
Figure 5.
Synergistic low-dose ATRi-CHK1i results in DNA replication stress and catastrophe in patient-derived HGSOC tumour cells. (A) Drug-sensitivity profiling assay of OCM.79 using ATRi and CHK1i at GI10 concentrations. Fluorescent object count of over 96 hours in the presence and absence of treatment as indicated, normalised to t = 0. Data are reproduced from Figure 4B, with each point representing the mean of three technical replicates ± SD. (B) Colony formation of OCM.79 following seven days or four weeks treatment with the GI10, GI20, GI50, GI75 or GI90 doses of ATRi and CHK1i for OCM.79, alone or in combination as indicated. Results are from a single experiment. (C) OCM.79 proliferation in a drug-concentration matrix of the indicated doses of ATRi and CHK1i for 72 h using the time-lapse proliferation assay. AUC was normalized to untreated cells. Data are from one technical replicate. (D) Matrix of the synergy-antagonism score generated from (C) using the Loewe additivity model. The drug average synergy scores are given to show the localisation of the synergy. The integrated weight sum of synergy and antagonism is also given, representing the total synergy/antagonism measurements across the matrix. (E) Immunoblot for CDC25A, CHK1, and CHK1 serine-345 phosphorylation, in OCM.79, with no treatment or after 2h treatment with the GI10 doses of ATRi and CHK1i alone or in combination. CDC25A is the upper band of approximately 65 kDa. Tao1 is included as a loading control. Representative immunoblot of two biological replicates. (F) Mean nuclear γH2AX intensity by immunofluorescence staining, following 48h treatment of OCM.79 or FNE1 cells with the GI10 doses of ATRi and CHK1i alone or in combination, normalized to untreated cells. (G) Mean RPA foci per nucleus by immunofluorescence staining, following 48h treatment of OCM.79 with the GI10 doses of ATRi and CHK1i alone or in combination, normalized to untreated cells. (H) Median length of IdU-labelled nascent DNA fibre in untreated OCM.79, or OCM.79 pre-treated for 80 min with the GI10 doses of ATRi and CHK1i alone or in combination (with treatment conditions then continued during 20 min IdU pulse). (F–H) Mean ± SD from three biological replicates, one-way ANOVA, *P ≤ 0.05, ***P ≤ 0.001, n.s. P > 0.05. GI10, GI20, GI50, GI75 or GI90 doses for OCM.79 and FNE1 cells were derived using the proliferation assay. See also Supplementary Figures S5–S7.

