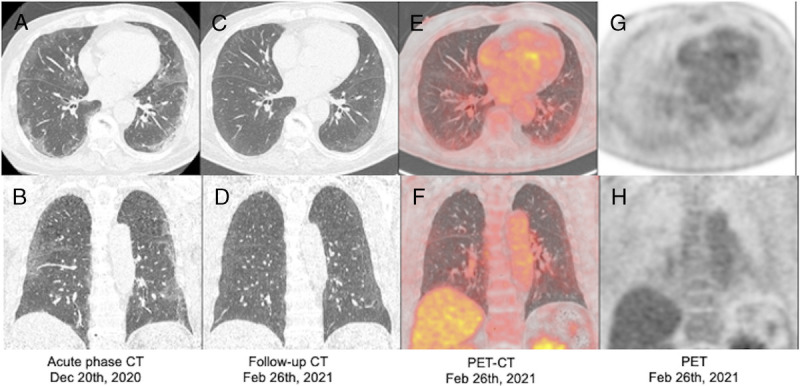
FIGURE 2.

Chest CT images of a patient with COVID-19 pneumonia (acute-phase) and follow-up CT and chest-dedicated 18F-FDG PET/CT images of the same patient. Acute-phase CT images (A and B) show bilateral peripheral GGOs and linear opacities. Those obtained 70 days after symptom onset (C and D) depict partial absorption of the opacifications. 18F-FDG PET/CT images (E–H) show greater uptake in the lung periphery, overlapping the mild areas of GGOs.
