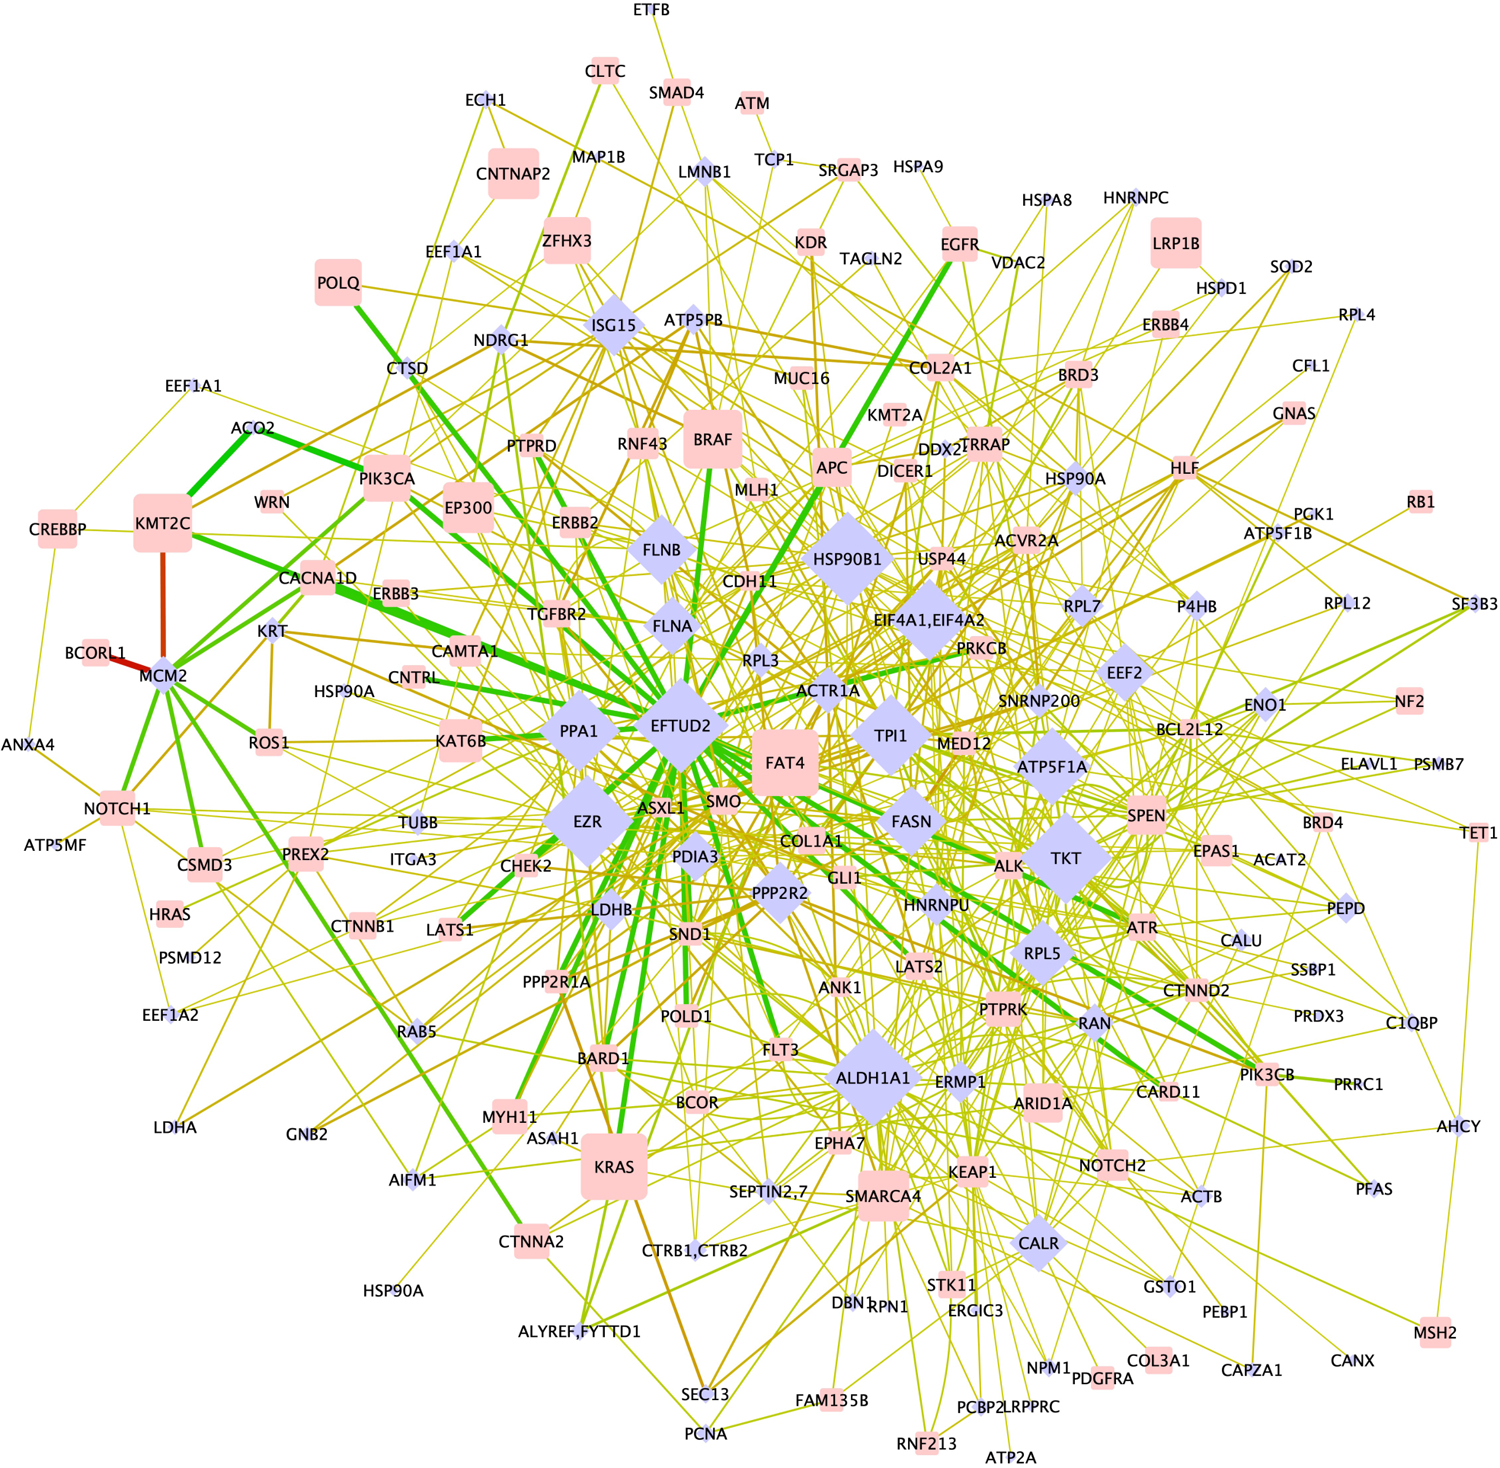
Figure 2: CPP revealed correlations between 3D alterations and somatic mutations.

The bipartite network shows the correlation of somatic mutated proteins (oncogens and tumor suppressor genes, blue diamonds) to non-mutated effector proteins (rectangles) in which at least one lysine site is significantly altered in accessibility. The size of nodes scales with connectivity (effector proteins) or number of cell lines in which the protein is mutated (mutated proteins). Edges are colored green in case a decrease in surface accessibility was detected and red in case surface accessibility of the lysine site increased. The line thickness reflects the difference in lysine site accessibility (Δ) between cell lines with and without mutation in the somatically mutated protein.
