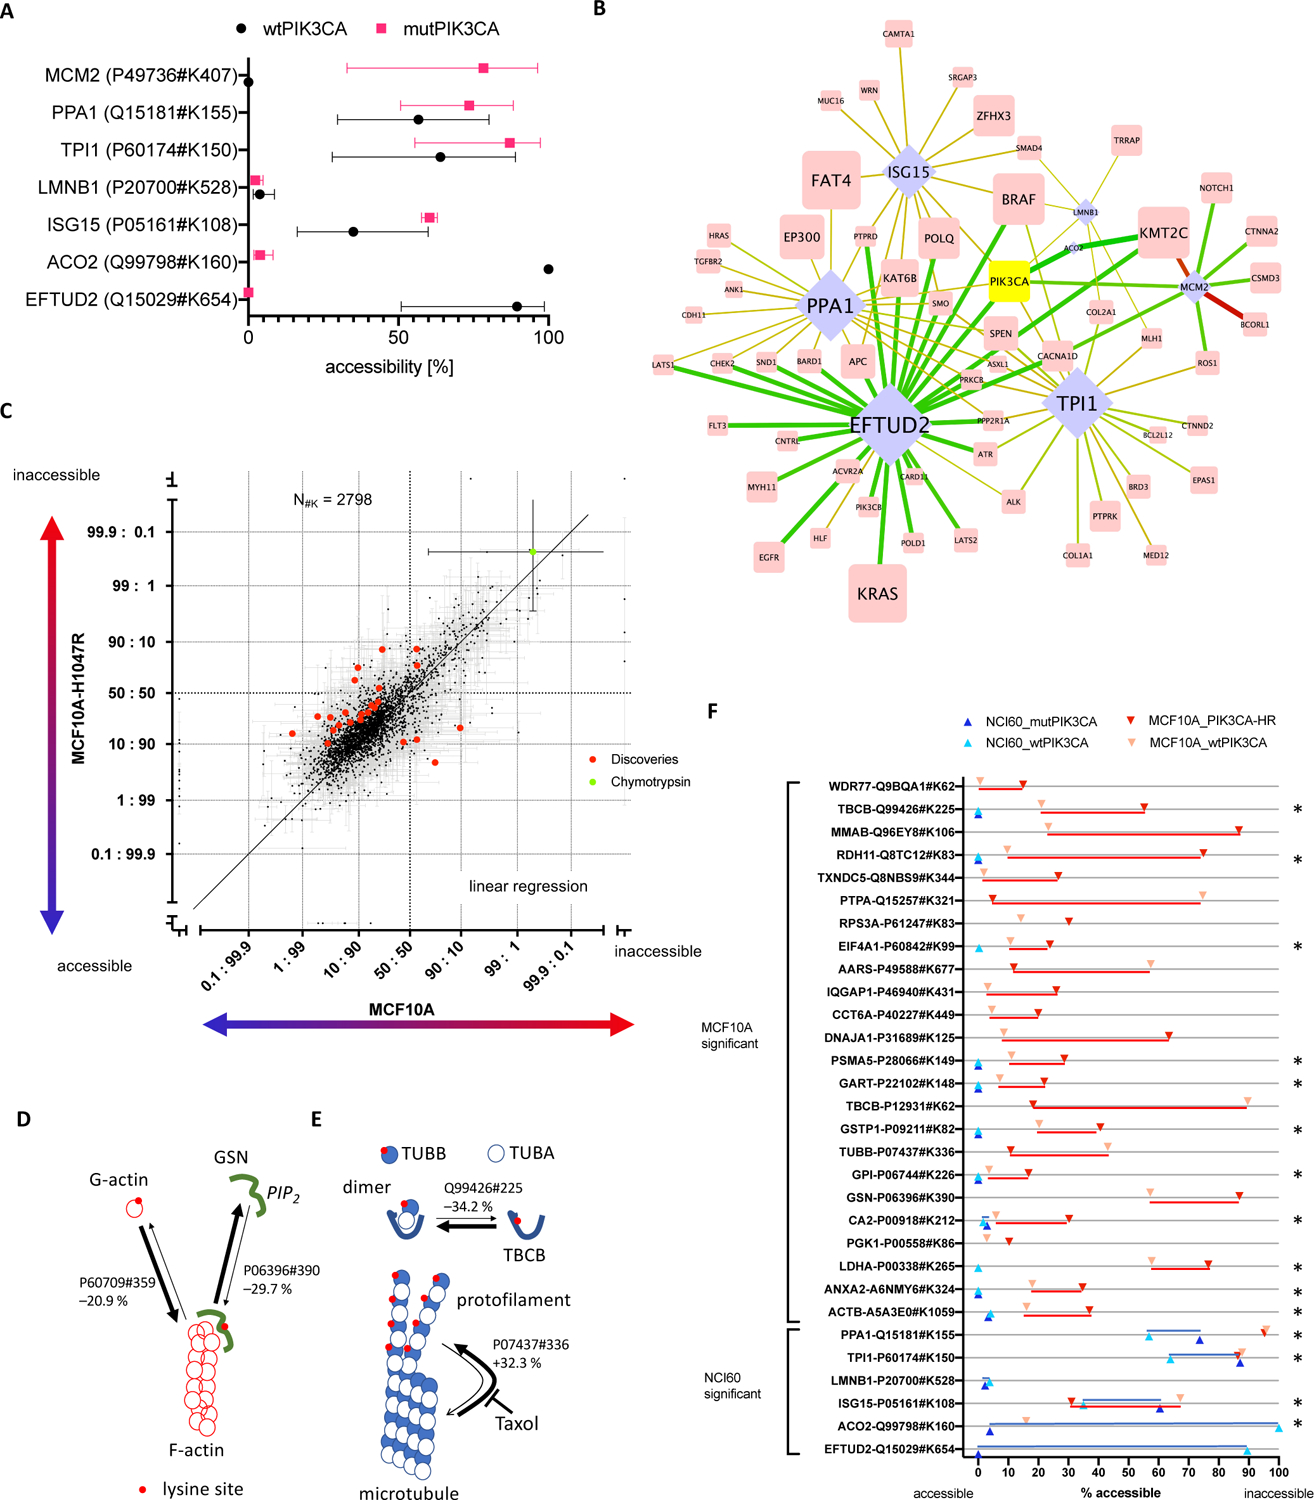
Figure 3: Comparison of 3D proteome alterations that correlate with oncogenic PIK3CA mutation in the NCI60 cell line panel and that were identified upon de novo mutating PIK3CA in MCF10A cells.

(A) Lysine site accessibilities for each effector protein that correlated with mutated and wt PIK3CA are indicated in red and black, respectively (error bars are standard deviation). (B) The bipartite network highlights interactions of PIK3CA in Figure 1C (identical figure annotation). Lysine site accessibility in six proteins differed significantly between 10 cell lines that harbored somatic mutations for PIK3CA (mutPIK3CA) and 50 cell lines with wtPIK3CA. (C) The scatterplot includes all lysine sites measured upon oncogenic activation of PIK3CA in MCF10A cells. Each dot represents an individual lysine site. Each lysine site was plotted with error of measurement (standard deviation) for its relative surface accessibility in MCF10A and MCF10A-H1047R cells (log2 converted value, inaccessible: accessible). The units “accessible” and “inaccessible” indicate that the lysine site was completely accessible or inaccessible. Lysine sites that were significantly altered in accessibility (q < 1%) are highlighted in red. Measurements obtained for Chymotrypsin site CRBT1#K54 (green dot) represent a positive control for “completely inaccessible” because Chymotrypsin was exogenously added following the initial labeling of the sample in CPP. The schematics (D) and (E) map changes in lysine site accessibility of proteins involved in actin and microtubule homeostasis. Protein-protein interactions and turnover of actin filaments and microtubules were altered upon oncogenic activation of PIK3CA in MCF10A cells. Red dots on protein surfaces pinpoint lysine sites accessible for CPP. Arrows indicate the homeostatic relationship between individual proteins and protein complexes. The thickness of the arrows show the relative change in the equilibrium upon mutation of PIK3CA according to the lysine site. (F) Comparison of significantly altered sites upon introduction of PIK3CA mutation in MCF10A cells (red) and presence of PIK3CA mutation in 10 out of 60 cancer cell lines (blue). Each measurement in lysine site accessibility is indicated and dark coloring refers to oncogenic PIK3CA, whereas light coloring represents the reference. Stars indicate lysine sites that were measured in both experiments.
