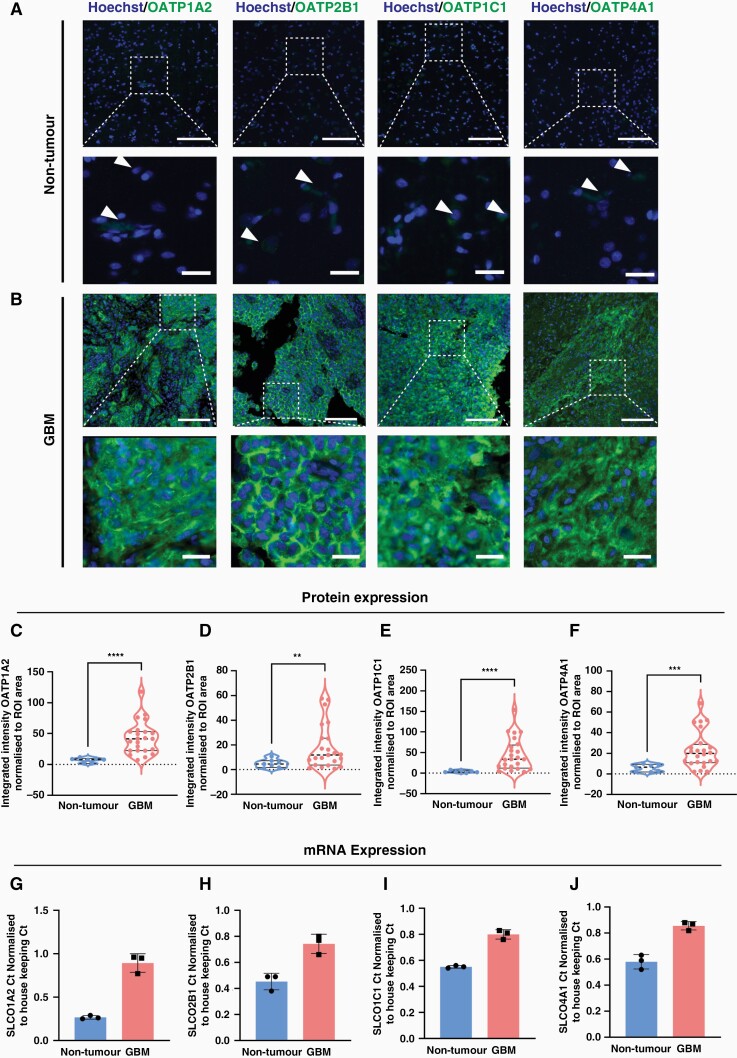
Figure 1.
Tissue-wide integrated intensity analysis reveals an overexpression of OATP1A2, 2B1, 1C1 and 4A1 in GBM tissue. Representative immunohistochemical labelling of OATP1A2/OATP2B1/OATP1C1/OATP4A1, as labelled with Hoechst nuclear counterstain in non-tumour (A) and GBM (B) tissue; scale bar = 100 μm, inset = 75 μm. The mean integrated intensity of OATP1A2, 2B1, 1C1, and 4A1 was compared between GBM and non-tumour with a non-parametric Mann-Whitney test (C–F), data compared between tumour (n = 25 cases) and non-tumour (n = 8 cases) tissue with Mann-Whitney test, presented as violin plot, median ± upper and lower quartiles. qRT-PCR quantifying the mRNA expression of OATP1A2, 2B1, 1C1 and 4A1 in GBM tumour tissue compared to non-tumour MTG brain tissue (G–J), data represents the mean ± SD of GBM (n = 3 cases) and non-tumour (n = 3 cases) fresh-frozen cases. **P < 0.01, ***P < 0.001, ****P < 0.0001.

