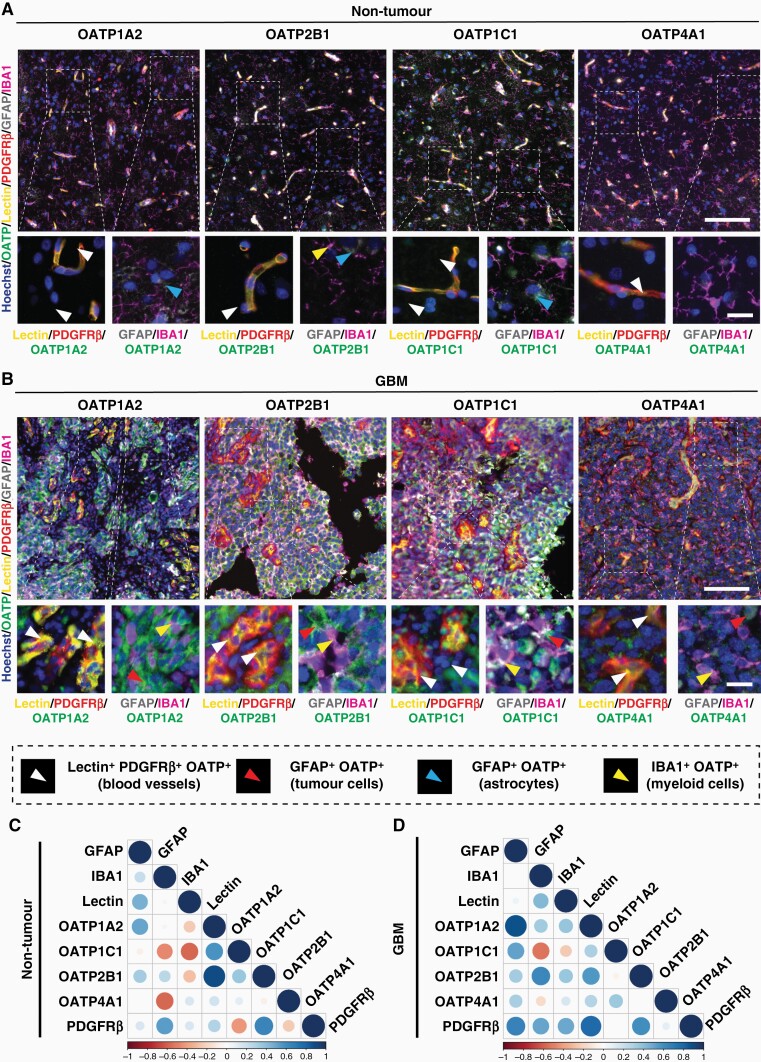
Figure 2.
Increased expression of OATP1A2, 2B1, 1C1 and 4A1 in GBM tissue across multiple cell types. Representative immunohistochemical labelling of OATP1A2/OATP2B1/OATP1C1/OATP4A1, as labelled with pan myeloid marker, IBA1; tumour cell/astrocyte marker, GFAP; endothelial cell marker, UAE-1 lectin; stromal cell marker, PDGFRβ; and Hoechst nuclear counterstain in non-tumour (A) and GBM (B) tissue; scale bar = 100 μm, inset= 20 μm. Manual cell population classification of blood vessels, tumour cells, astrocytes, and myeloid cells from cell-specific marker expression is defined in the figure key. OATP integrated intensity normalised to ROI area was correlated with cell-type specific markers to predict cell-type specific expression of OATPs in non-tumour (C) and GBM (D) tissue using Spearman correlations. Data presented as a matrix of correlation coefficients between markers; n = 8 cases (non-tumour), n = 25 cases (GBM).

