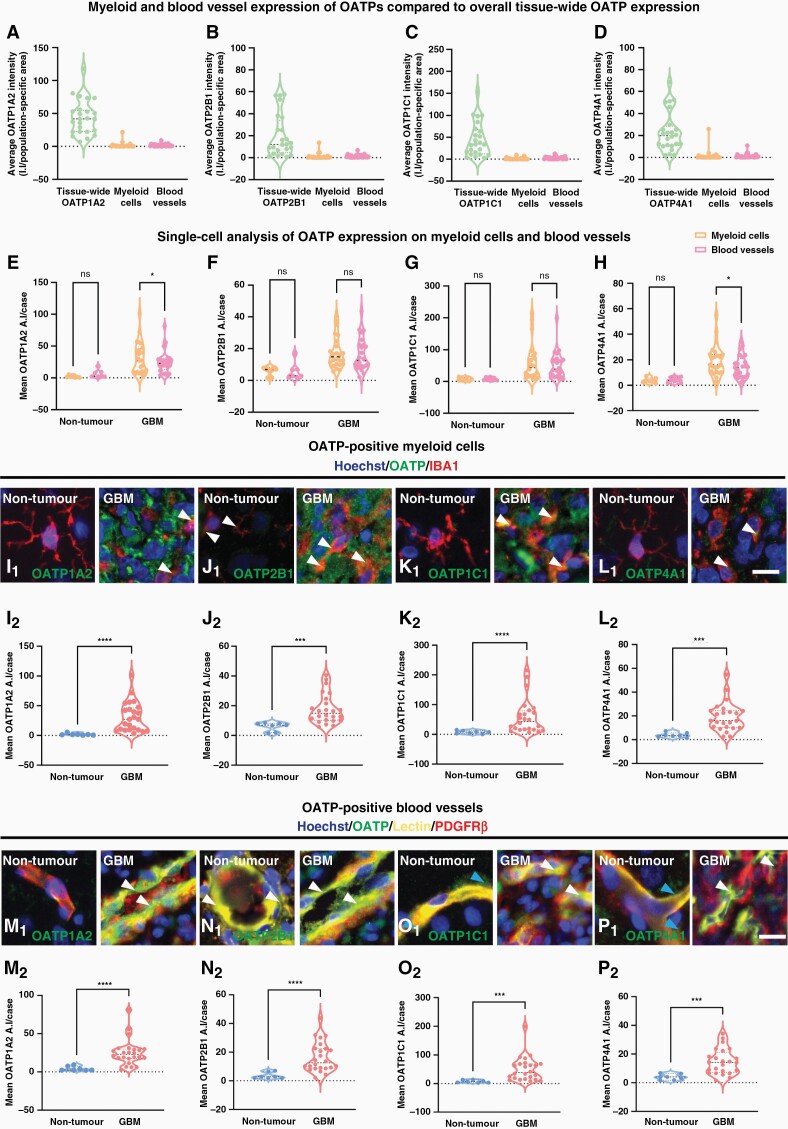
Figure 3.
Single-cell average intensity analysis of the cell-type specific expression of OATP1A2, 2B1, 1C1 and 4A1 revealed increased expression on myeloid cells and vasculature in GBM tissue. The tissue-wide expression of OATP1A2 (A), 2B1 (B), 1C1 (C), and 4A1 (D) was compared with single-cell analysis of the average OATP intensity per cell within the OATP-positive—IBA1, and lectin masks in GBM tissue. Single-cell analysis of the mean average intensity per case of each OATP isoform within OATP-positive—IBA1, and lectin masks in tumor and non-tumor tissue (E–H). Pooled single-cell analysis of the mean stain average intensity per cell was compared for each OATP isoform within the IBA1-positive (I–L) and lectin-positive mask (M–P) in GBM and non-tumor tissue. Each of the OATP isoforms was individually compared between GBM and non-tumor tissue with a Mann–Whitney test, data presented as median ± upper and lower quartiles (I–P). Representative images of OATP isoforms in GBM and non-tumor IBA1-positive cells and blood vessels (white arrow), blue arrow denotes vascular associated OATP immunoreactivity; scale bar = 10 μm. Significance was determined using an unpaired Mann–Whitney test. n = 8 cases (non-tumor) n = 25 cases (GBM); *P < .05, ***P < .001, ****P < .0001.

