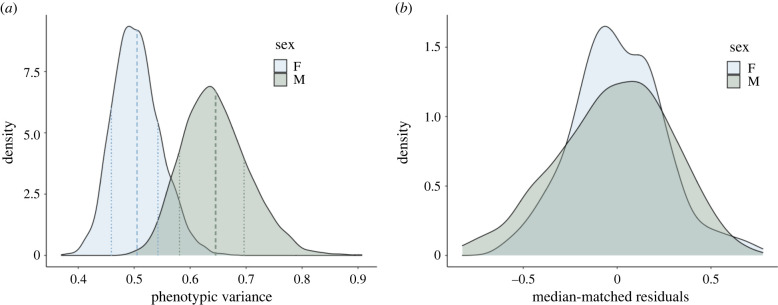
Figure 1.
Males exhibit more variable relative ECVs than females. (a) Density plots of the posterior distributions of phenotypic variance for males (green) and females (blue) from a GLMM of relative ECV (in which both the additive genetic and residual terms were partitioned into their effects for males and females separately). Dashed lines indicate sex-specific means and dotted lines indicate 68% HPD intervals for these means. (b) Median-matched (0 = median for each sex) density plots of male (green) and female (blue) residual distributions from a GLMM of relative ECV (in which both the additive genetic and residual terms were partitioned into their effects for males and females separately).

