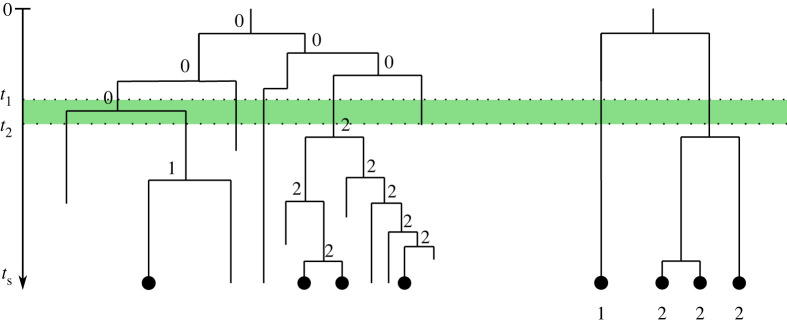
Figure 1.
Example cell phylogeny for initial cell with one genomic target. Numbers denote the target state at each node: 0 corresponds to an unedited, 1 to a silenced and 2 to a scarred target. Targets can be silenced at any time. Scarring can only occur during the scarring window (shading). Internal nodes represent cell divisions and branch lengths the time between them. Left: complete developmental phylogeny with all cells and their target state at internal nodes. Right: reconstructed phylogeny of only the cells sampled at time ts. (Online version in colour.)

