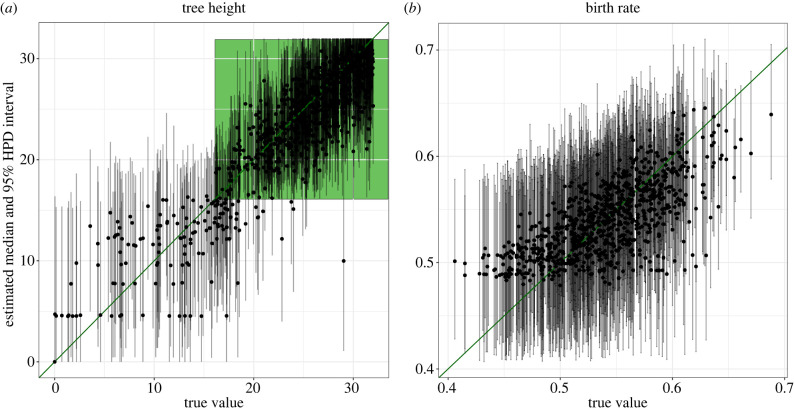
Figure 3.
Parameter estimates based on simulated data. The graphs show the median estimates (black dots) and 95% HPD intervals (grey lines) on the y-axis and the true values on the x-axis based on 860 simulations. Two different parameters are shown: (a) tree height and (b) birth rate. The diagonal green line indicates the performance of a perfect estimator. The green shaded area in a illustrates the time period in which editing takes place. Thus, if the most recent common ancestor of the cells is younger than the editing period, the sequencing data does not contain any signal on the tree topology. (Online version in colour.)

