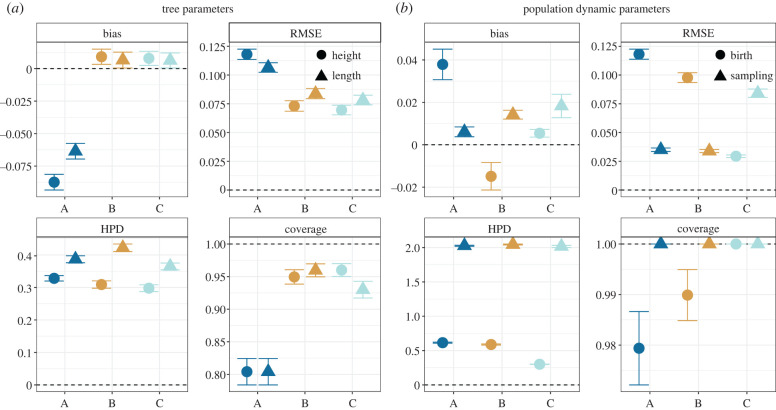
Figure 4.
Inference performance when using different inputs. Input description: A = barcode alignment; B = barcode alignment and scarring rates; C = 10 barcode alignments from experimental replicates and scarring rates. Bias, RMSE, HPD width and coverage for the (a) tree height and tree length, and (b) birth rate and sampling proportion, based on different inputs. The error bars show the standard errors of the mean. The dashed line shows the best possible value for each metric. (Online version in colour.)

