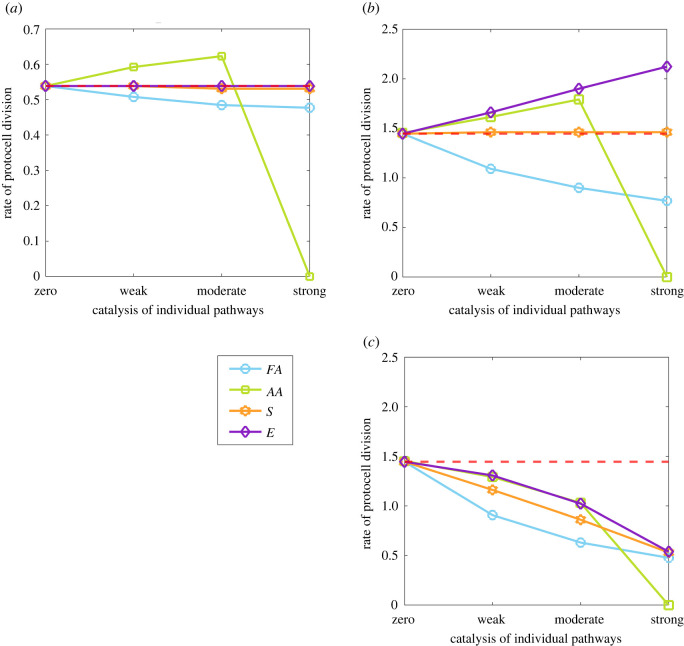
Figure 3.
Impact of nucleotide catalysis of individual pathways on protocell division rate. Changes in protocell division per day are shown for nucleotide catalysis of the synthesis pathways of amino acids (AA, green), fatty acids (FA, blue), energy (E, purple) and sugars (S, orange). In each panel, nucleotide catalysis ranges from zero () to weak (), moderate () and strong () of specific pathways i = AA, FA, S, E. These rates are considered in relation to (a) slow () and (b) fast () rates of CO2 fixation, given no cost to catalysis (α = 0). In (c), a cost to catalysis (α = 1) is introduced in proportion to the strength of nucleotide catalysis (with fast rates of CO2 fixation). The red dotted line indicates the number of protocell divisions per day with nucleotide catalysis of CO2 fixation alone (i.e. no catalysis of other synthesis pathways, as in figure 1b). Other parameter values are given in table 1.

