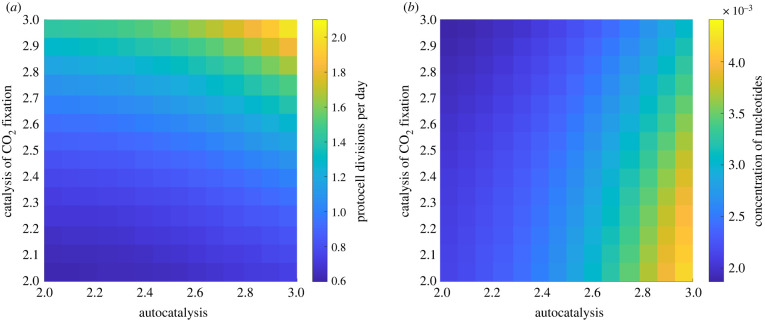
Figure 5.
Impact of nucleotide autocatalysis and catalysis of CO2 fixation on protocell division rate and nucleotide concentration. Heat maps show (a) the number of protocell divisions per day and (b) the mean protocell concentration of nucleotides at equilibrium when varying the rate of nucleotide autocatalysis () and nucleotide catalysis of CO2 fixation (). Other parameter values are given in table 1. (Online version in colour.)

