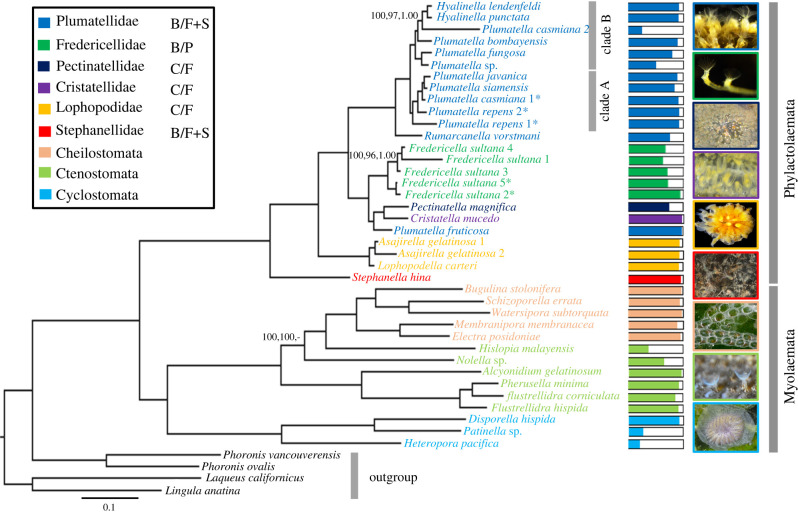
Figure 1.
Maximum-likelihood phylogeny of Phylactolaemata based on the main data matrix using the partitioned analysis. Values on some nodes represent ML bootstrap support of the partitioned analysis, ML bootstrap support of the unpartitioned analysis with PMSF model and Bayesian posterior probabilities, respectively. Bootstrap support and Bayesian posterior probabilities are only shown for nodes that are not maximally supported by all analyses. Dashes in support values indicate that a relationship was not recovered. The asterisks with species names indicate that species were collected from Austria. Coloured bars show the proportion of genes sampled for each taxon. The scale bar represents 1 substitutional change per 100 AAs. Abbreviations next to phylactolaemate families represent charters mapping for colonies (B, branching; C, clustered) and statoblasts (F, floatoblast; S, sessoblast; P, piptoblast). (Online version in colour.)

