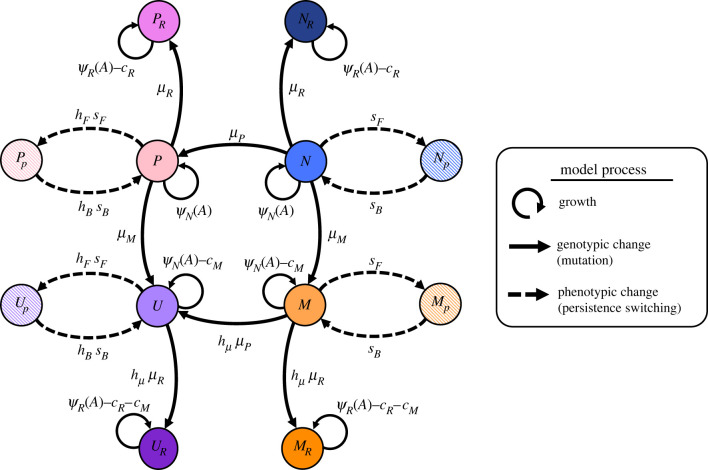
Figure 2.
Illustration of the full mathematical model describing resistance, high-persistence and hyper-mutator dynamics. The eight genotypes consist of the wild-type (N), hyper-mutators (M), high-persisters (P), mutator–persisters (U) and their corresponding resistant mutants denoted by subscript R (electronic supplementary material, table S1). Persister phenotype states (hatched) are denoted by a subscript p. Switching between these two states (dashed arrows) happens at rates sF and sB for N and M, and with hF- and hB-fold increase for P and U. Net growth rates as determined by AB sensitivity (equation (2.3), electronic supplementary material, text S3) are given as ψN for susceptible (MIC = 1) and as ψR (MICR = 10 x MIC) for resistant genotypes, together with growth costs due to resistance, cR, and due to hyper-mutation, cM. Solid arrows show mutational transitions between genotypes, which happen at rates µM, µP and µR. Mutators (M, U) have hµ-fold increased mutation rates. See electronic supplementary material, table S2 for parameter values.

