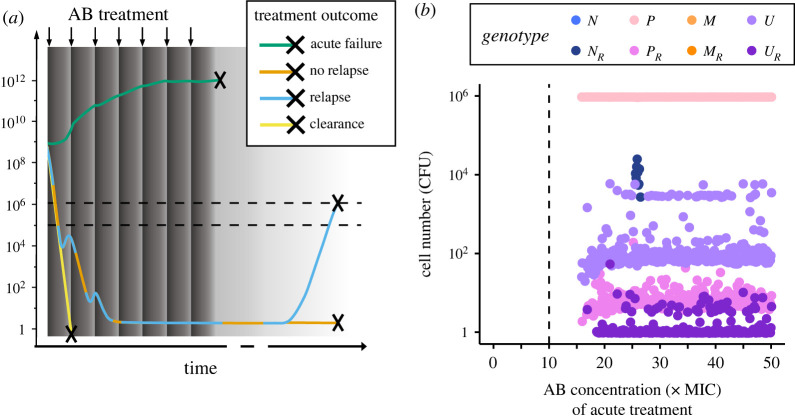
Figure 5.
Relapse is mainly caused by persister phenotypes. (a) Bacteria are either cleared (yellow line) or survive 8-day AB treatment (dark grey area; periodic dosing is indicated by arrows and AB decay as a gradient). Surviving bacteria either cause immediate treatment failure (greater than 105 CFU, lower dashed line) at the end of treatment (green line) or, due to regrowth from less than 105 CFU, which leads either to relapse (greater than 106 CFU as indicated by the upper dashed line; blue) or no relapse (remaining below 106 CFU; orange) over the course of 10 years. (b) Mean cell numbers (CFU) of each genotype at relapse for a range of AB concentrations used in the treatment (0–50 × MIC). The vertical dashed line shows the MICR.

