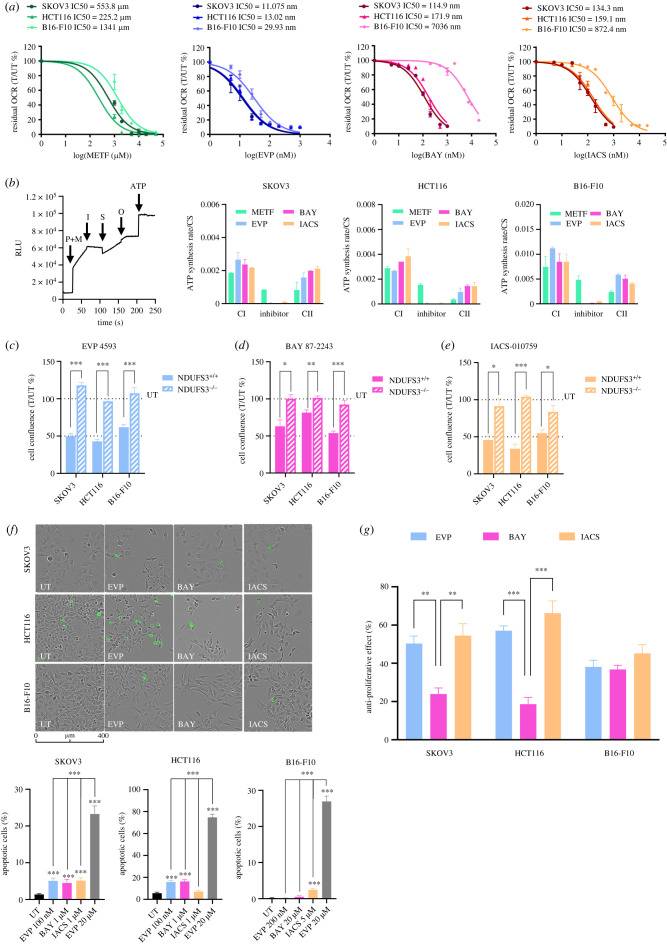
Figure 4.
(Overleaf.) Optimized concentrations of EVP 4593 and BAY 87-2243 reduce cell proliferation without triggering apoptotic cell death. (a) Concentration-response analysis of metformin (METF), EVP 4593 (EVP), BAY 87-2243 (BAY) and IACS-010759 (IACS) on SKOV3, HCT116 and B16-F10 cell lines. Residual oxygen consumption rate (OCR) is expressed as percentage and was calculated using the last rate measurement before compound injection (T) to untreated (UT) samples. Compound concentrations were expressed as logarithm to base 10 (Log). Data were shown as mean ± s.e.m. (n = 2). DMSO was used as a control for EVP 4593, BAY 87-2243 and IACS-010759 untreated (UT) samples. For metformin titration, cells were pre-incubated with the compound for 24 h before OCR measurement. (b) CI- and CII-driven ATP synthesis rates in permeabilized cells. A general experiment scheme is shown as an example of the assay. Injections are indicated by arrows and correspond to CI-driven ATP synthesis using pyruvate and malate as substrates (P + M), followed by inhibitors injection (I), CII-driven ATP synthesis using succinate (S) as substrate, ATP synthase inhibition by oligomycin (O) and lastly, internal standard (ATP). Permeabilized SKOV3, HCT116 and B16-F10 cells were treated with metformin (50 mM), EVP 4593 (100 nM for SKOV3 and HCT116, 200 nM for B16-F10), BAY 87-2243 (1 µM for SKOV3 and HCT116, 20 µM for B16-F10) and IACS-010759 (1 µM for SKOV3 and HCT116, 5 µM for B16-F10). Data are normalized on citrate synthase (CS) activity and expressed as mean ± s.e.m. (n ≥ 2). Data of CI-driven ATP synthesis rate are reported as ‘CI', those after the treatment above mentioned inhibitors are indicated as ‘Inhibitor' and those regarding CII-driven are labelled as ‘CII'. (c–e) Proliferation of NDUFS3+/+ and NDUFS3−/− cell lines under treatment with optimized concentrations of (c) EVP 4593 (100 nM for SKOV3 and HCT116, and 200 nM for B16-F10), (d) BAY 87-2243 (1 µM for SKOV3 and HCT116, and 20 µM for B16-F10) and (e) IACS-010759 (1 µM for SKOV3 and HCT116, and 5 µM for B16-F10). Data are presented as cell confluence ratio of treated (T) to untreated (UT) control cells after 72 h of incubation. Cell confluence was previously normalized on time 0 (T0). Student t-test was performed between NDUFS3+/+ and NDUFS3−/− cells, for each cell line and treatment condition. Data are mean ± s.e.m. (n ≥ 4) and statistical significance is specified with asterisks (*p ≤ 0.05, **p ≤ 0.01, ***p ≤ 0.001). (f) Representative images of SKOV3, HCT116 and B16-F10 cell lines treated with the optimized concentrations of EVP 4593, BAY 87-2243 and IACS-010759 for 72 h, in presence of caspase-3/7 activated fluorescent dye. Scale bars: 400 µm. Magnification: 10×. Cell confluence and green fluorescence were analysed using Incucyte Live-imaging System. Quantification of apoptotic cells expressed as percentage in each treatment was calculated dividing the number of positive green objects by total number of cells per field. Cells treated with 20 µM EVP 4593 (EVP) were used as positive controls. Data are mean ± s.e.m. (n = 3) and Student t-test was performed between untreated (UT) and treated samples. Statistical significance is specified with asterisks (*p ≤ 0.05, **p ≤ 0.01, ***p ≤ 0.001). (g) Anti-proliferative effect for EVP 4593, BAY 87-2243 and IACS-010759 in SKOV3 and HCT116 (100 nM, 1 µM and 1 µM, respectively) and B16-F10 (200 nM, 20 µM and 5 µM respectively) cell lines under 72 h of treatment. Data are expressed as [100% (UT) – cell confluence ratio (T/UT %)]. Data are mean ± s.e.m. (n ≥ 3) and Student t-test was used to evaluate significant differences in anti-proliferative effect among the three CI inhibitors. Statistical significance is specified with asterisks (*p ≤ 0.05, **p ≤ 0.01, ***p ≤ 0.001).

