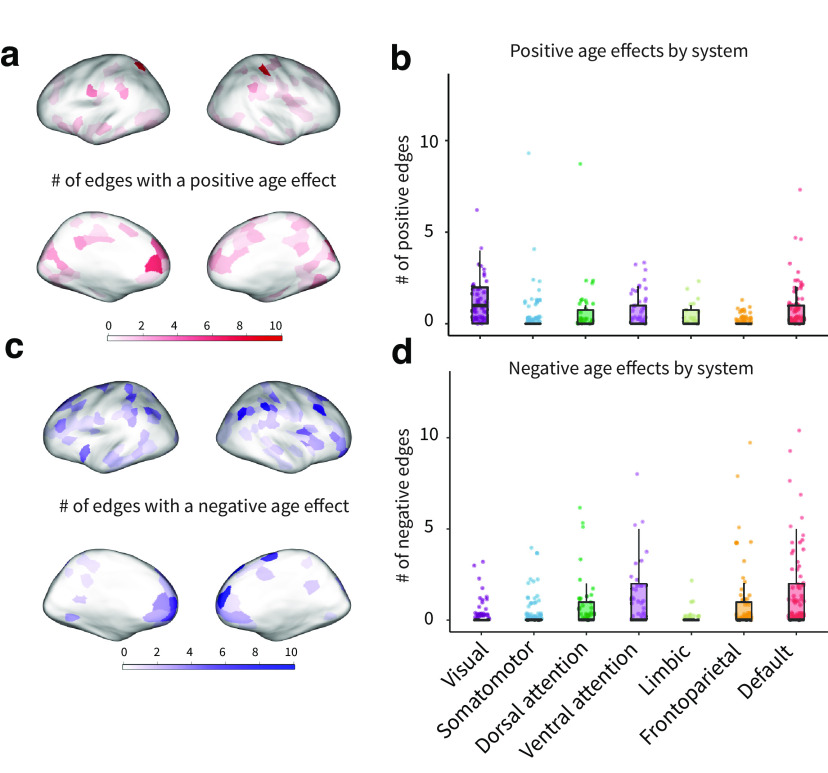
Figure 3.
Parcel-level effects of age on network connectivity. a, Number of edges from each parcel showing a significant positive age association; significance was defined as . b, Number of edges with positive effects of age, grouped by system. Each datapoint represents a parcel. c, Number of edges from each parcel showing a significant negative age association; significance was defined as . d, Negative edge effects for each parcel grouped by system. Each data point represents a parcel. punc: uncorrected p value.

