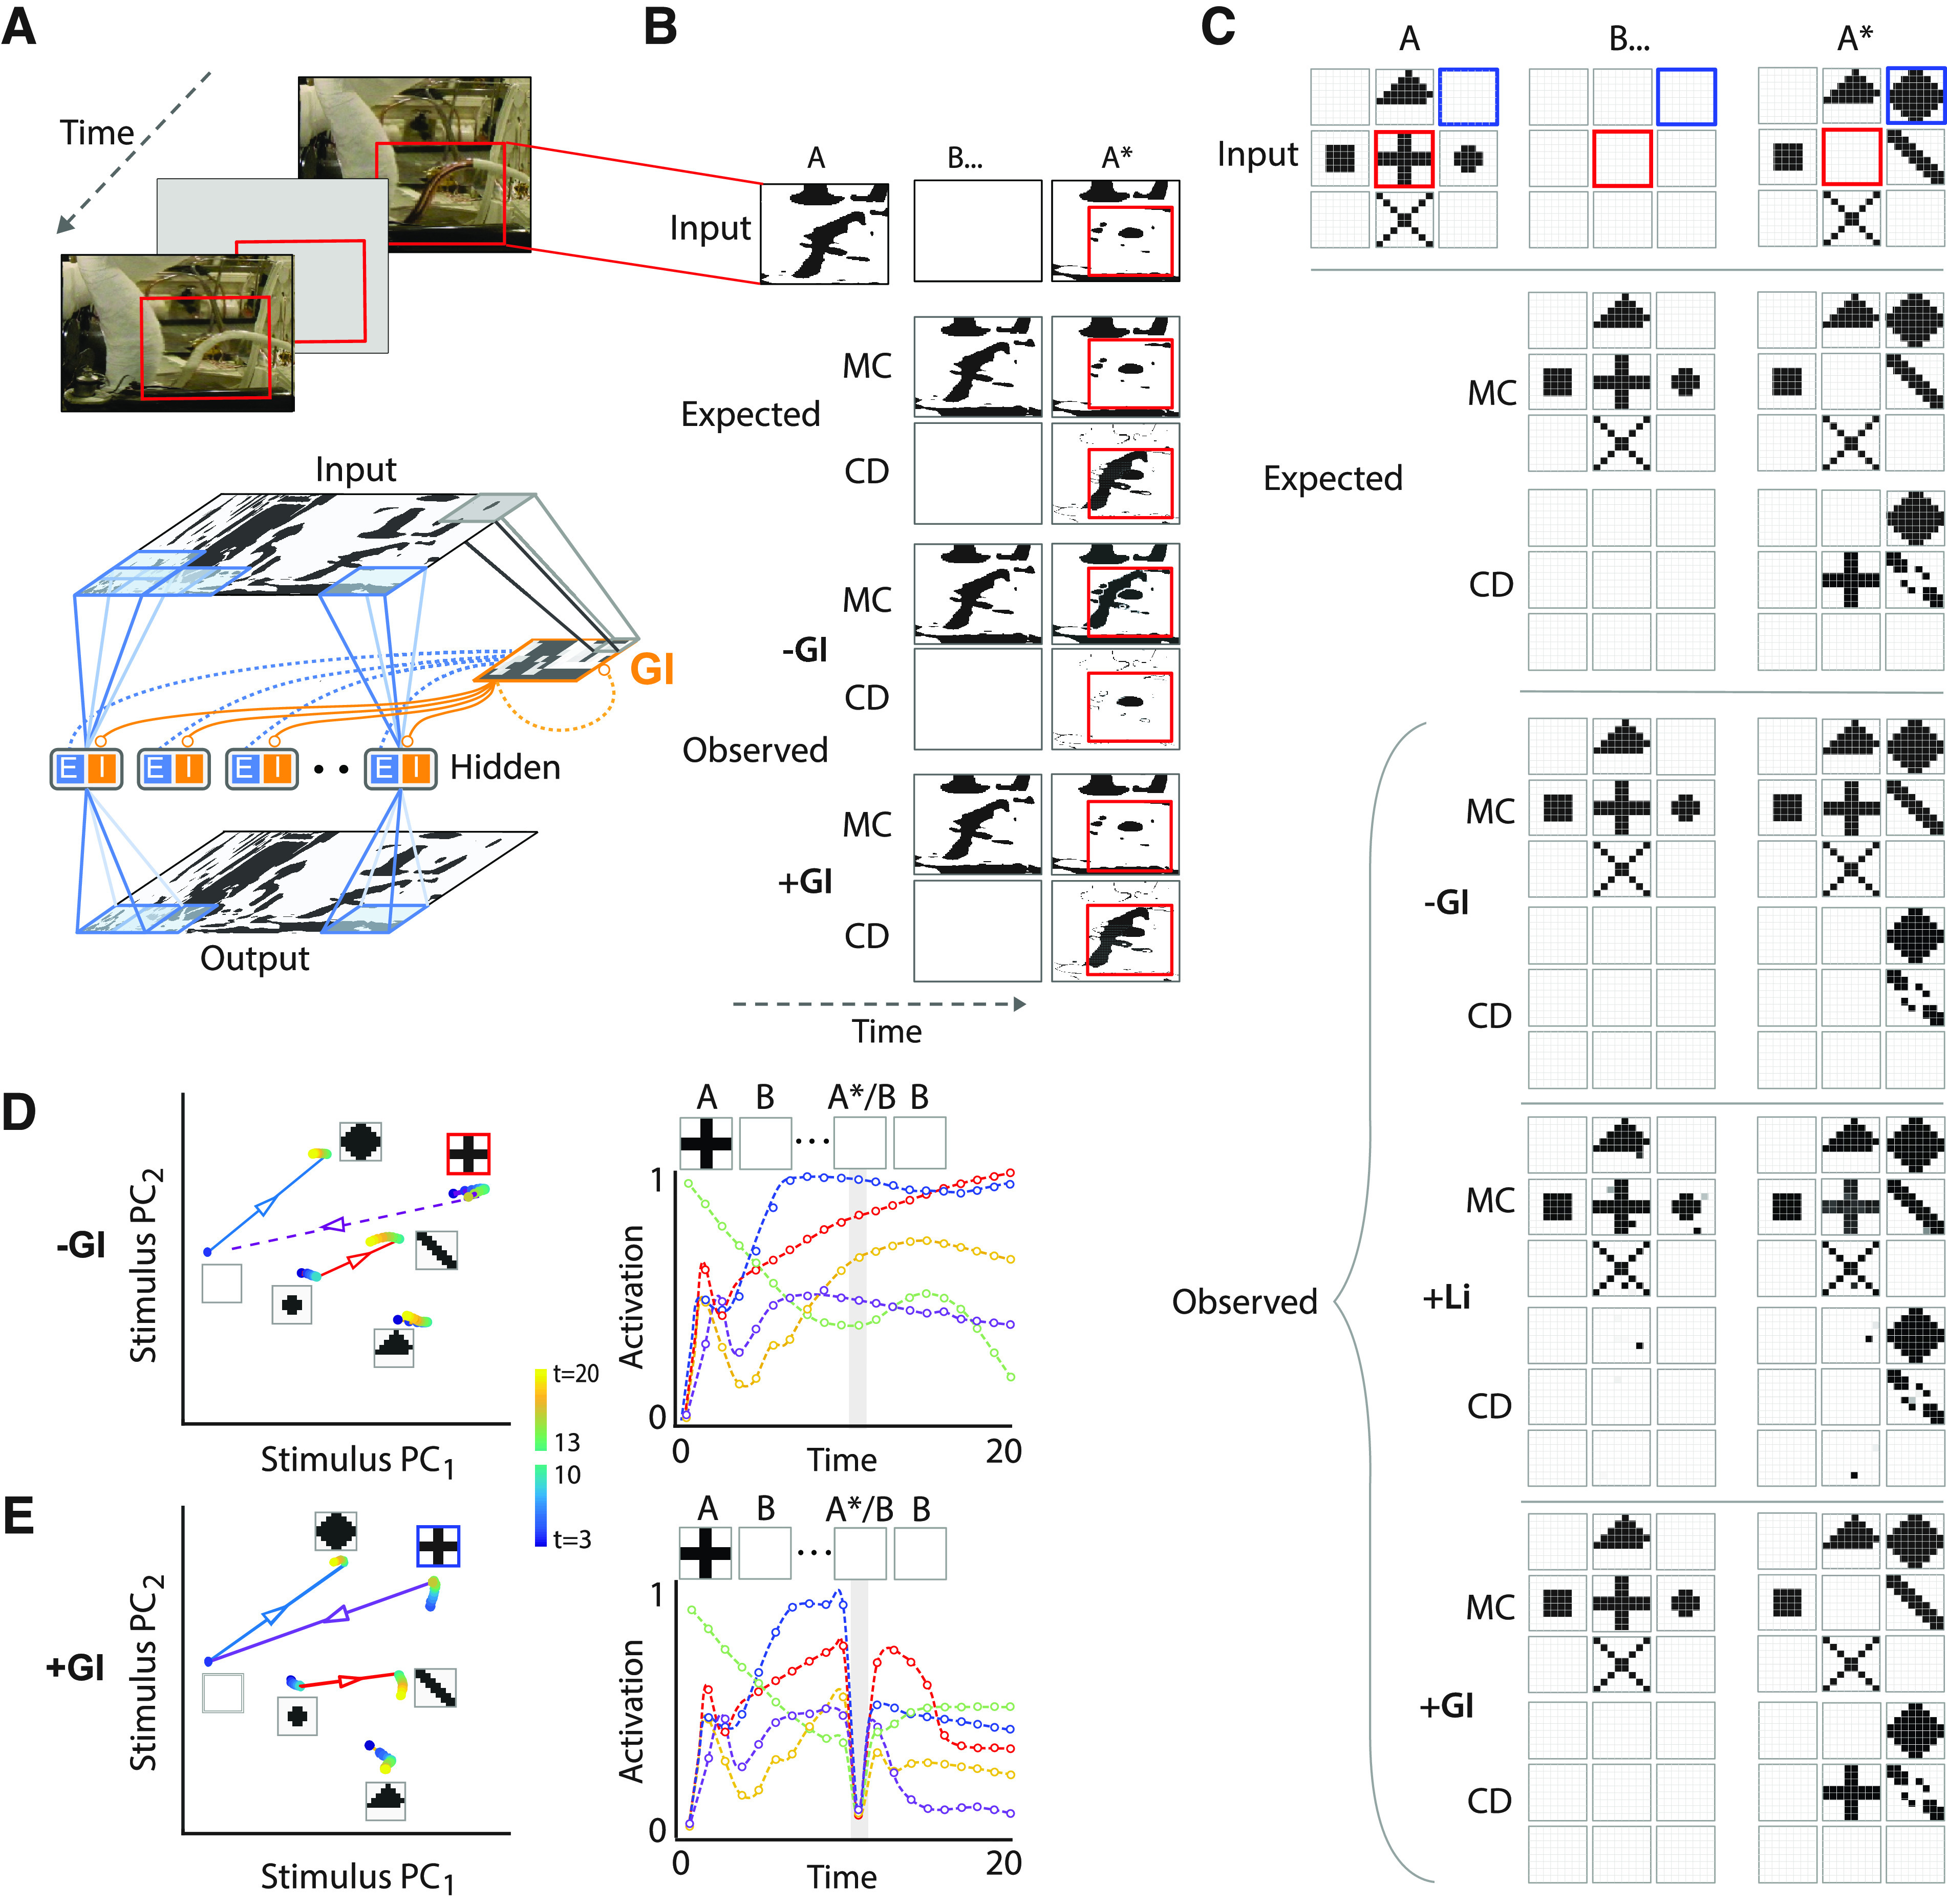
Figure 4.

Global inhibition enables change detection with natural images. A, Top, Schematic of change detection with a representative natural image (resolution: 1024 × 768), interspersed by blanks. Red rectangle: location of change (not part of the image). Bottom, 8 × 8 st-RNN modules tiled to represent the full resolution image (overlapping blue patches in both input and output map). st-RNN modules were tiled with 50% overlap along both horizontal and vertical directions, such that each 4 × 4 patch in the image (except for patches closest to the border) was processed by four different st-RNN modules. Orange outline: global inhibition (GI) layer, mimicking the architecture of the Imc connection (Fig. 1A, orange nucleus). Gray lines: convergent, topographic connections from input to the GI layer; orange circles: inhibitory connections from the GI layer to both E and I neurons in the hidden layer of each st-RNN module; dashed connections: recurrent excitatory connections from E neurons in the hidden layer to neurons in the GI layer (in blue) and recurrent inhibitory connections among neurons in the GI layer (in orange); these connections were implemented in one variant of the network incorporating the GI layer (Materials and Methods). B, Topmost row, Thresholded, binarized saliency map around the region of change (red box; see text for details). Second and third rows, The expected output (ground truth) of mnemonic coding (MC) and change detection (CD) st-RNNs, respectively. Fourth and fifth rows, Output of the trained MC and CD st-RNN models before incorporating the global inhibition layer (−GI). Sixth and seventh rows, Output of the trained MC and CD st-RNN models after incorporating the global inhibition layer (+GI). For all rows, the middle and right columns represent the output of the respective st-RNN during the blank (B) and change image (A*) epochs, respectively. Red outlines: location of change. C, Analysis of a toy-example with nine st-RNN modules tiled in a 3 × 3 square grid, with no overlap. Rows 1–3, Input to the st-RNN modules (1st row), and the expected ouputs of the MC st-RNN (2nd row), and CD st-RNN (3rd row). Rows 4–9, Outputs of the trained MC and CD st-RNN models before incorporating the global inhibition layer (–GI; 4th and 5th rows), after incorporating local (short-range) recurrent interactions (+Li; 6th and 7th rows), and after incorporating the global inhibition layer (+GI; 8th and 9th rows). Other conventions are the same as in panel B. Top row, Red box: on-off transition; blue box: off-on transition. D, Left, Projection of hidden layer activity for each st-RNN (panel C) into the mnemonic subspace, in the absence of global inhibition (−GI). Trajectories begin from the first blank, when the first image was maintained (blue shaded dots; t = 3–10), through a transition corresponding to the presentation of the change image (lines with superimposed arrowheads), followed by the second blank, when the change image was maintained (green to yellow shaded dots; t = 13–20). Insets, Input images for each st-RNN module from the toy example (panel C). The st-RNN failed to accomplish the on-off transition (“plus” shape to blank) successfully (dashed purple arrow). Right, Activity of five representative hidden layer units, each represented by a different color, of the mnemonic coding st-RNN corresponding to the middle pattern (“plus”) from panel C. In absence of global inhibition (–GI) unit activity failed to reset on presentation of the change image (A*). Dots: data for each bin; dashed lines: spline fits; gray shaded bar: time point (t = 11) corresponding to presentation of the change image. E, Same as in panel D but in the presence of global inhibition (+GI). Left, The st-RNN accomplished the on-off transition (“plus” shape to blank) successfully (solid purple arrow). Right, In the presence of global inhibition (+GI) unit activity “reset” on presentation of the change image (gray shading).
