
Figure 6.
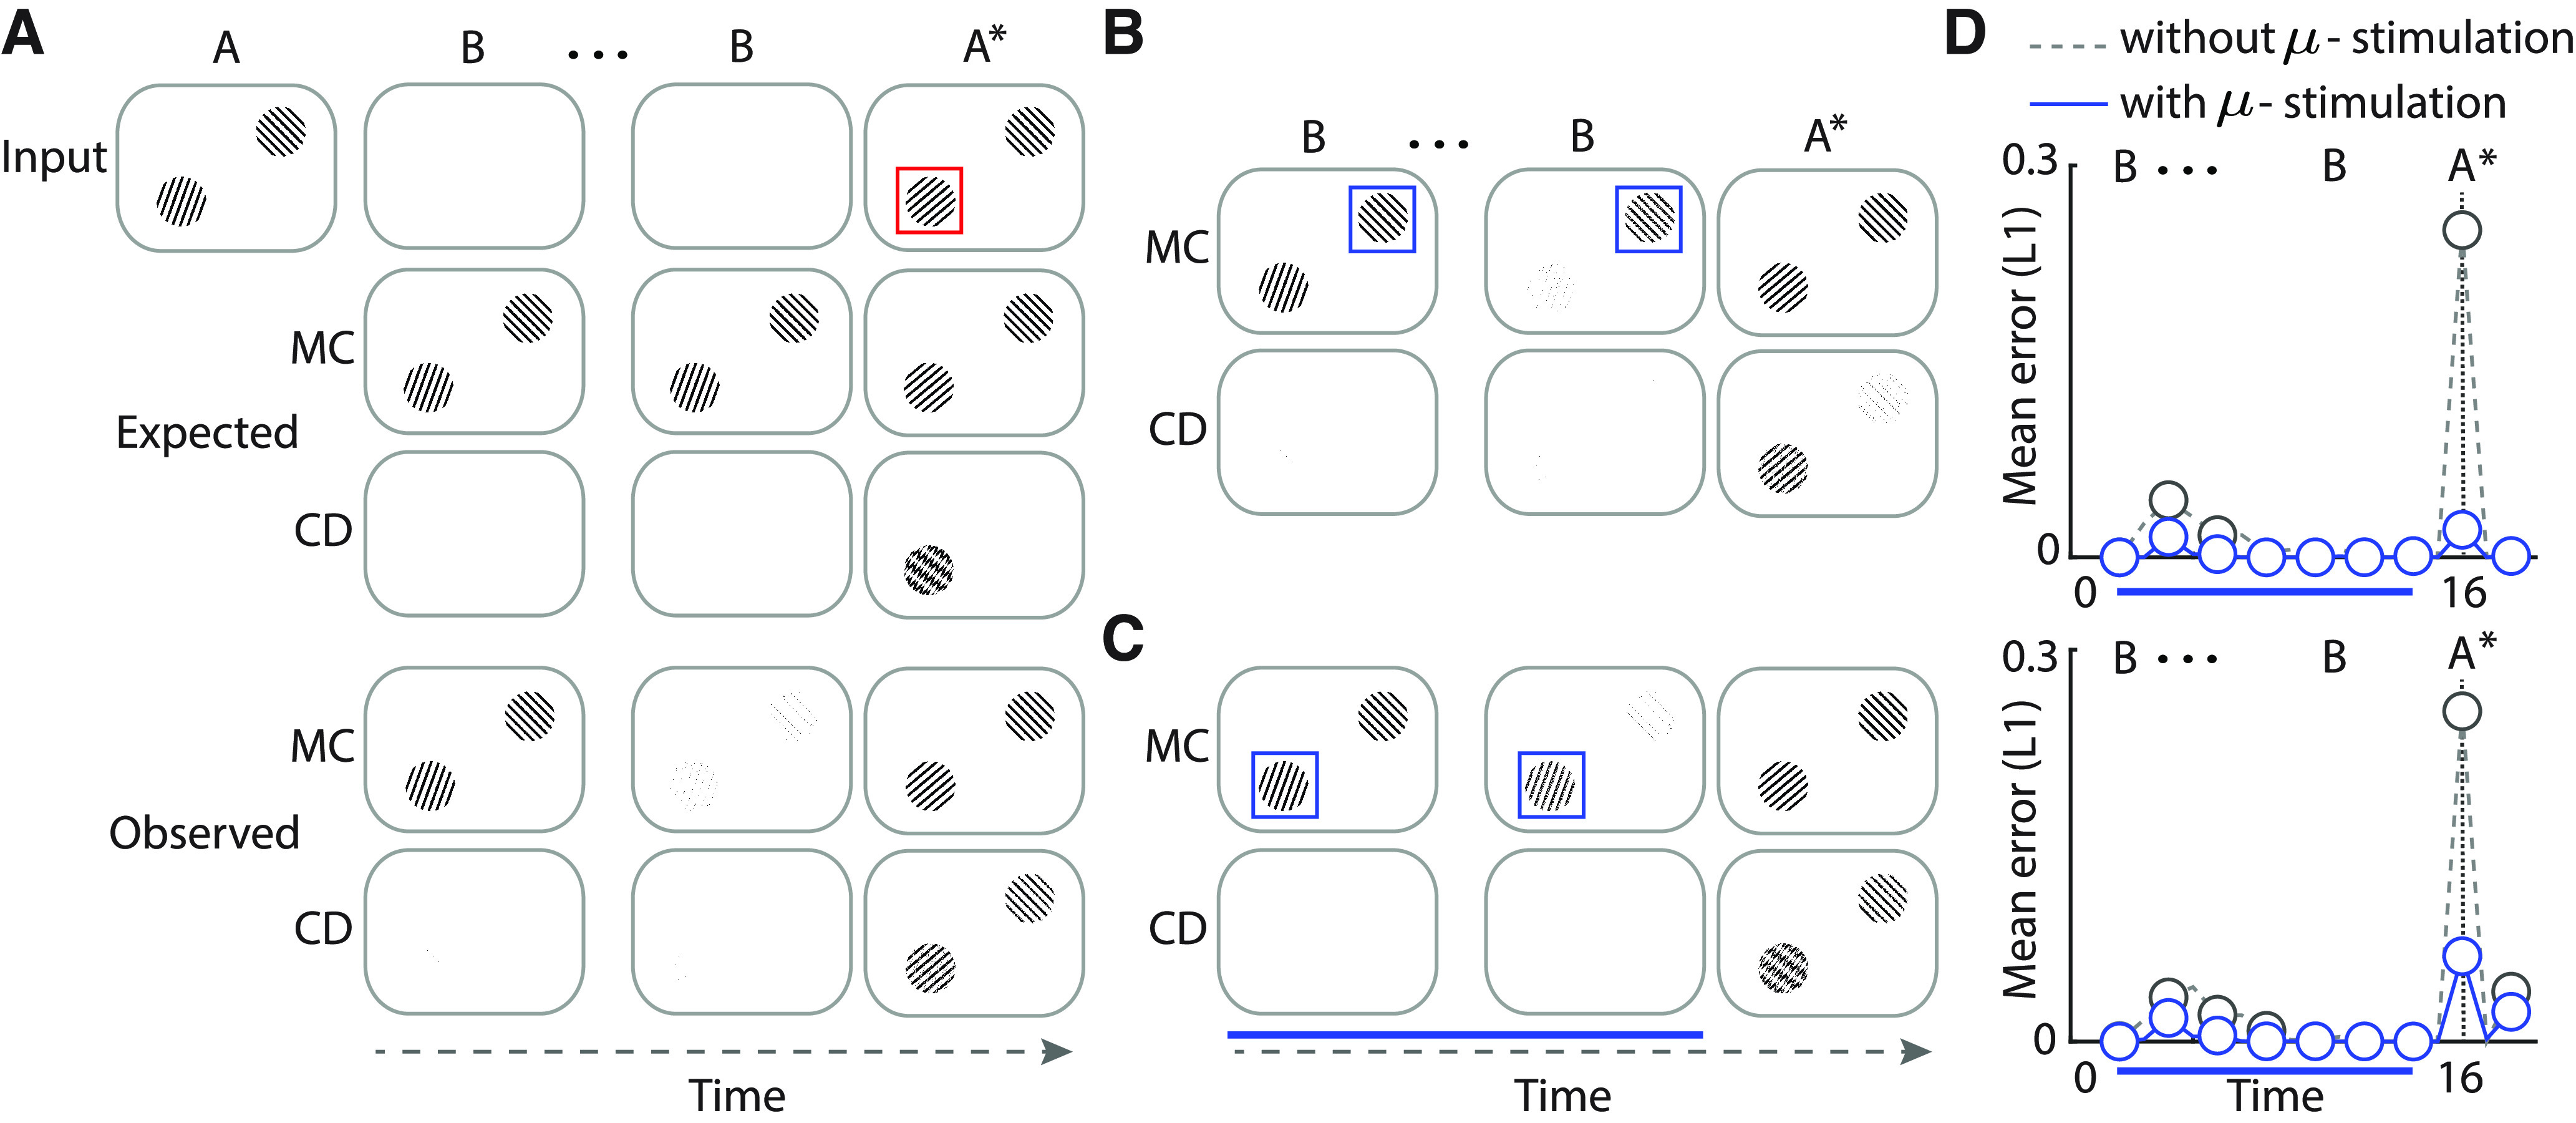
Simulated microstimulation rescues change detection deficits. A, Top row, Simulated laboratory change blindness task. Two oriented gratings were presented, one in each visual hemifield. The entire image spanned 1000 × 800 pixels and was encoded with 50,000 overlapping st-RNN modules. Following the blank (B), a new change image occurred in which one of the gratings (here, the grating in the left hemifield) underwent a change in orientation. Middle row, Output of the mnemonic coding (MC) st-RNN. Bottom row, Output of the change detection (CD) st-RNN. Red box: location of change, is shown for illustration only, and is not presented along with the visual input. Other conventions are the same as in Figure 4B. B, The output of the mnemonic coding (first row) and change detection (second row) st-RNNs following simulated, focal microstimulation of the right hemifield (no-change) grating representation alone (see text for details). C, Same as in panel B but following simulated, focal microstimulation of the left hemifield (change) grating representation alone. Other conventions are as in panel B. B, C, Blue box, Location of simulated microstimulation, is shown for illustration only and is not presented along with the visual input. Blue horizontal bar: duration of microstimulation. D, Quantification of change in performance following the simulated microstimulation experiments of panel B (top) and panel C (bottom), respectively. Top, Mean L1 error for units representing the right hemifield (no-change) grating without (gray dashed) or with (blue solid) simulated microstimulation. Dashed vertical lines: time of appearance of the changed image (A*). Other conventions are the same as in panel C. Bottom, Same as in the top but mean L1 error for units representing the left hemifield (change) grating. Other conventions are the same as in the top panel.