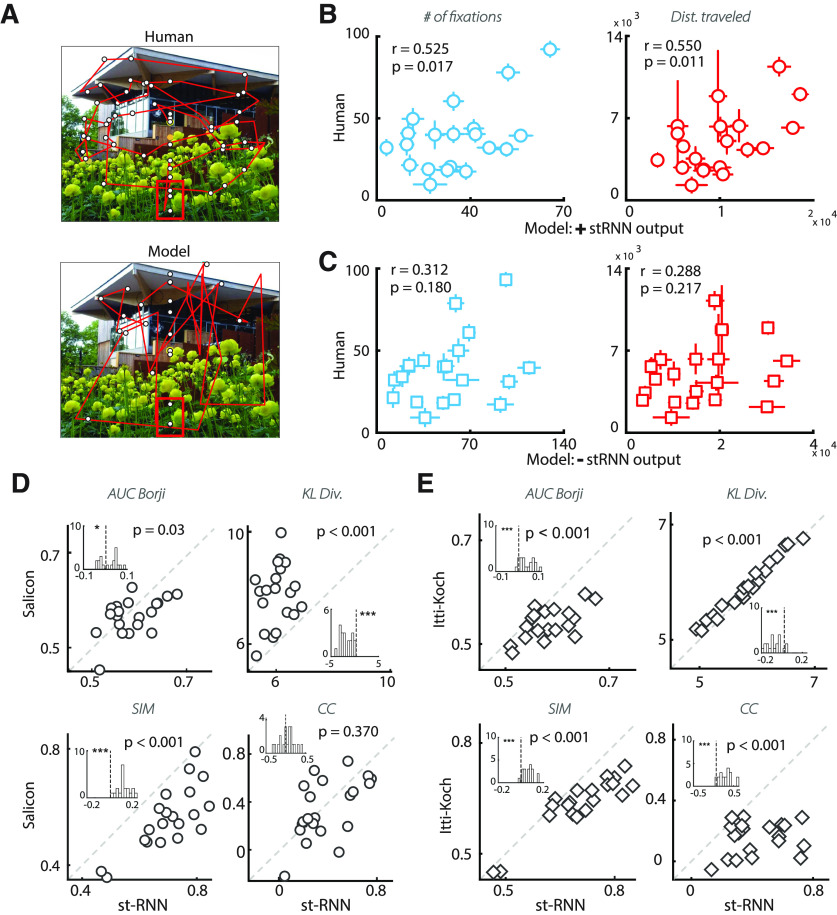
Figure 8.
st-RNN based gaze model mimics and predicts human strategies in a change blindness task. A, Comparison of gaze scan path for a representative human subject (top) versus a model's trial (bottom) on an example image from the change blindness experiment. Red box: location of change. B, Correlation between model (x-axis; average across n = 80 iterations) and human data (y-axis; average across n = 39 participants) for the number of fixations (left) and distance traveled (right) before fixating on the change region. Error bars: SEM. C, Same as in panel B, but for a model in which the priority map was computed after excluding the st-RNN output (see Materials and Methods). D, Distribution of four different saliency comparison metrics across 27 images for the fixation map predicted by the st-RNN model (x-axis) versus the map predicted by the Salicon algorithm (y-axis) (Huang et al., 2015). Clockwise from top: AUC (Borji), KL-divergence, CC and similarity. Diagonal line: line of equality (x = y). For all metrics, except for KL-divergence, a higher value implies better match with human fixations. Insets, Distribution of difference between the st-RNN and Salicon prediction for each metric. E, Same as in panel D but comparing fixation predictions of the st-RNN model (x-axis) against that of the Itti–Koch saliency prediction algorithm (y-axis). Other conventions are the same as in panel D.

