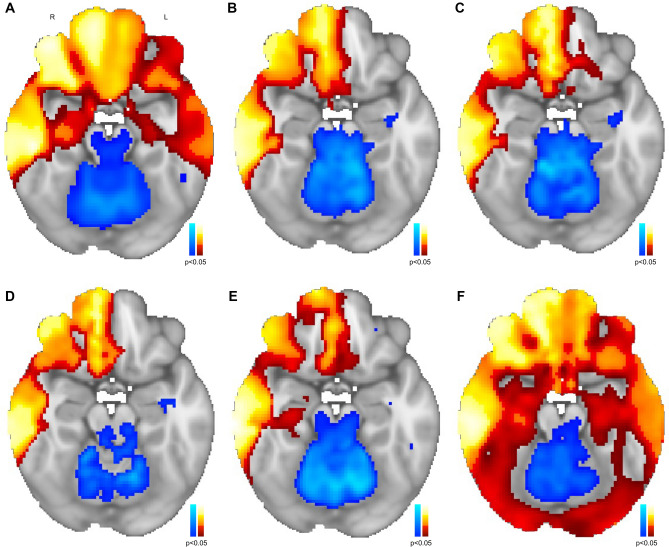
Fig. 1.
Lesional network mapping produced similar results across different connectomes. When compared to the resulting map from the original connectome (A), the validation lesional network maps produced similar results when using different connectomes: HCP 3T 937 (B); HCP 3T 155 (C); HCP 3T 937 shortened (D); HCP 7T (E); MBB (F). A strong spatial correlation, Pearson’s r varying from 0.85 to 0.99, between all lesional mania maps was obtained when comparing all network maps

