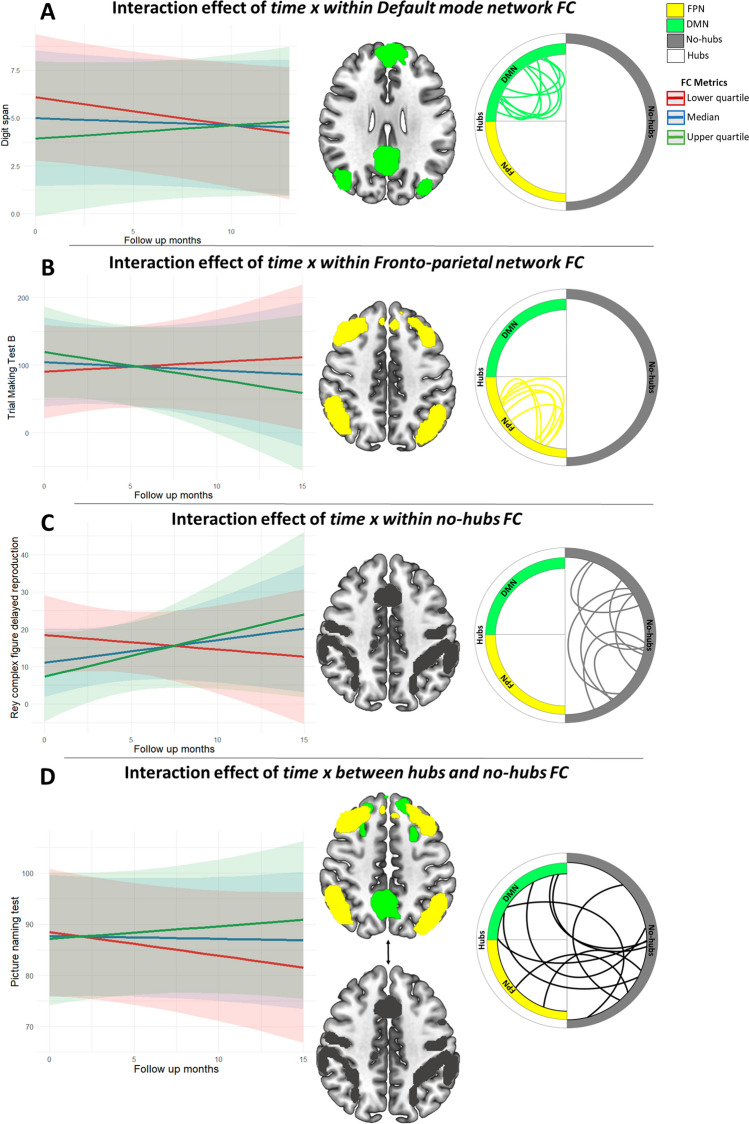
Fig. 4.
Prediction of the neuropsychological profile from longitudinal changes in functional connectivity metrics. Interactions effect for the neuropsychological profile of brain tumor patients, regardless of WHO tumor grade and tumor lateralization, by plotting the quartiles of the distribution of each FC metric. A Fixed interaction effect of time with default mode network (DMN) for Digit span. B Fixed interaction effect of time with fronto-parietal network (FTPN) for Trial Making Test B. C Fixed interaction effect of time with no-hubs for Rey complex Figure delayed reproduction and D between hubs and no-hubs for Picture naming. Circular plots represent, using simulated connections, the five types of functional connections evaluated: within DMN, within FTPN, within hubs, within no-hubs and between hubs and no-hubs

