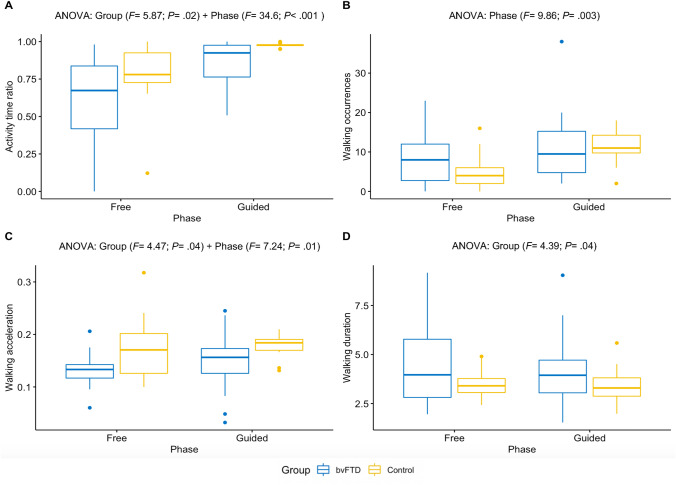
Fig. 2.
Effects of group and phase on four metrics quantifying goal-directed behaviors. A Activity time ratio. B Occurrences of walking episodes. C Mean acceleration of walking episodes. D Mean duration of walking episodes. BvFTD patients: N = 20; controls: N = 16. Only significant effects obtained from ANOVA tests are displayed for each of the four metrics. Extreme outlier measures were identified and removed: 3 measures of activity time ratio (1 control in free phase/2 controls in guided phase), 2 measures of walking acceleration (1 bvFTD in free phase/1 control in guided phase) and 1 measure of walking duration (1 control in free phase). In the boxplots: horizontal lines represent the first, second (median) and third quartiles of the distribution; vertical bars above and below the boxes figure the lowest 25% and the highest 25% of values, respectively; the dots indicate outliers (which were not identified as extreme outliers)

