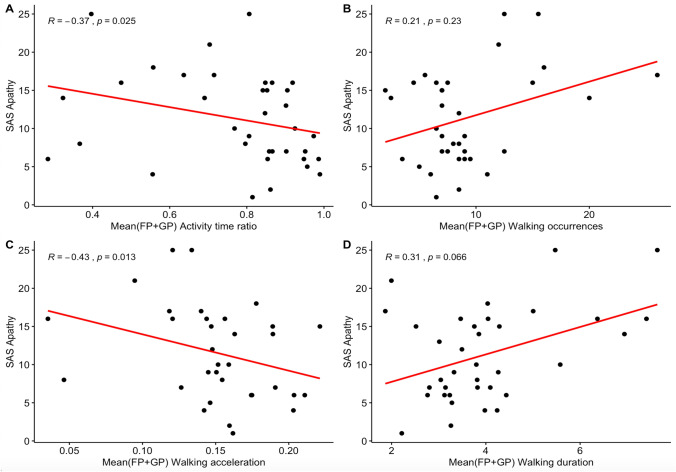
Fig. 3.
Correlations between apathy measured by the SAS and the four behavioral metrics. A Activity time ratio averaged on free and guided phases. B Occurrences of walking episodes averaged on free and guided phases. C Mean acceleration of walking episodes averaged on free and guided phases. D Mean duration of walking episodes averaged on free and guided phases. BvFTD patients: N = 20; Controls: N = 16. R is the Spearman’s rank correlation coefficient between the two variables; SAS, Starkstein Apathy Scale

