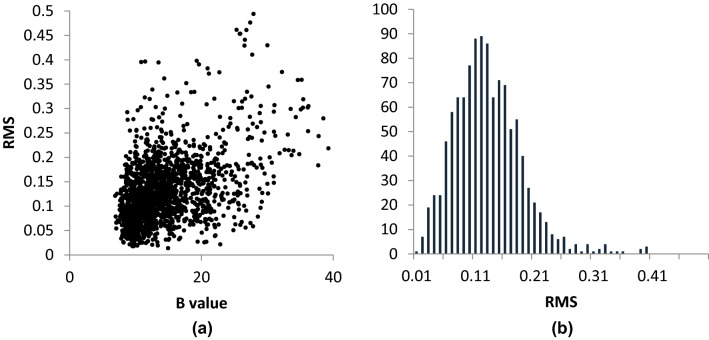
Fig. 3.
a Example of the scatter plot of average isotropic displacement parameters and RMS positional difference between pairs of equivalent atoms in two protein structures, and b histogram of RMS difference values constructed from a ‘window’ of displacement parameters (15 ± 6 Å2) of scatter plot in Fig. 3a. Data were taken from the pairwise comparison of 5ACF and 5ACG. All other distributions are given in the Supplementary Information

