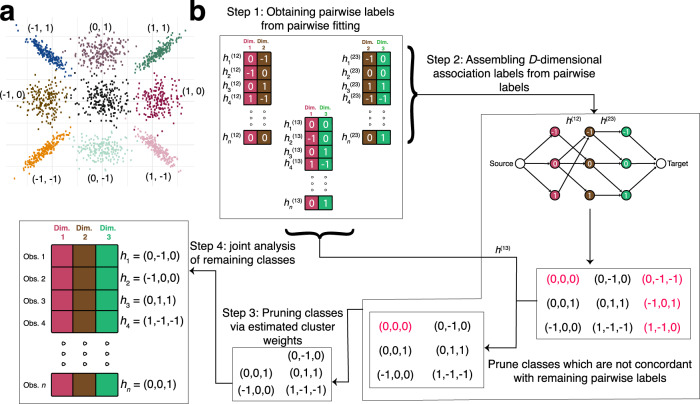
Fig. 1. Toy example of CLIMB.
a Illustration of the considered model using a simulated dataset with two dimensions. The 9 classes are annotated by their corresponding latent association vectors. The null class (0, 0) lies in the center over the origin. Classes that are non-null in at least one dimension exhibit a location shift. Only observations from classes that are non-null in both dimensions are correlated. b Flowchart of CLIMB with a 3-dimensional example, with true classes whose association vectors are denoted h1, h2, h3, h4, and hn. Step 1 fits 3 pairwise models. Pairwise association vectors are estimated for each observation in each pairwise fit. In Step 2, we enumerate candidate 3-dimensional association vectors using a graph-based algorithm based on the estimated pairwise association vectors (shown as edges) between dimensions 1 and 2, and the estimated pairwise association vectors between dimensions 2 and 3. 9 candidate association vectors are found on the graph, but those that are colored in red are not truly present in the data. Association vectors that are not concordant with estimated association vectors from the pairwise fit between dimensions 1 and 3 are pruned. With 6 remaining candidates, one computes their prior weights (Step 3), then in Step 4 fits a Bayesian mixture model to the original, 3-dimensional data using the number of classes remaining after Step 3.

