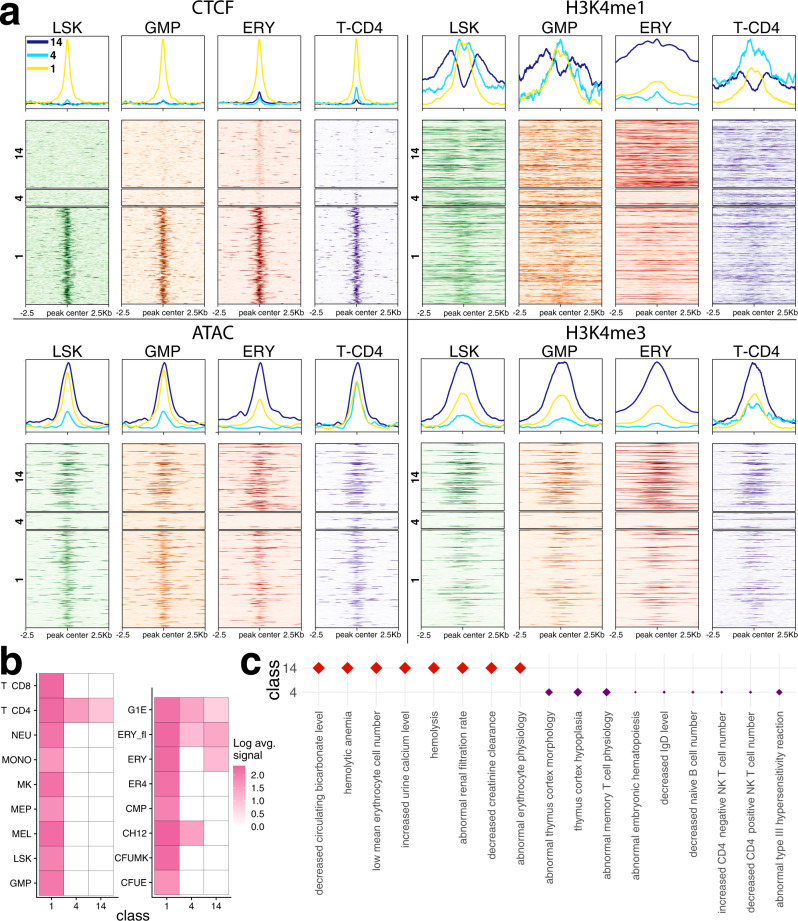
Fig. 3. CTCF binding patterns uncovered by CLIMB capture different patterns of epigenetic modifications.
a Data from the loci on chromosome 11 that belong to classes of CTCF binding patterns (numbered 1, 4, and 14) identified by CLIMB are shown. The original CTCF ChIP-seq, alongside ATAC-seq and histone modification ChIP-seq data in 4 hematopoietic cell populations reveal differing patterns of epigenetic modifications across cell populations. b Log class means based on CLIMB’s model of CTCF binding patterns for the 3 classes in (a). c Significantly enriched mouse phenotypes (FDR < 0.05 for all) associated with the plotted classes. Class 1, containing loci with CTCF bound in every cell type, is not significantly enriched in any mouse phenotypes. Class 4 is enriched with terms related to T and B cells and the thymus, while class 14 contains terms related to red blood cells and kidney function.

