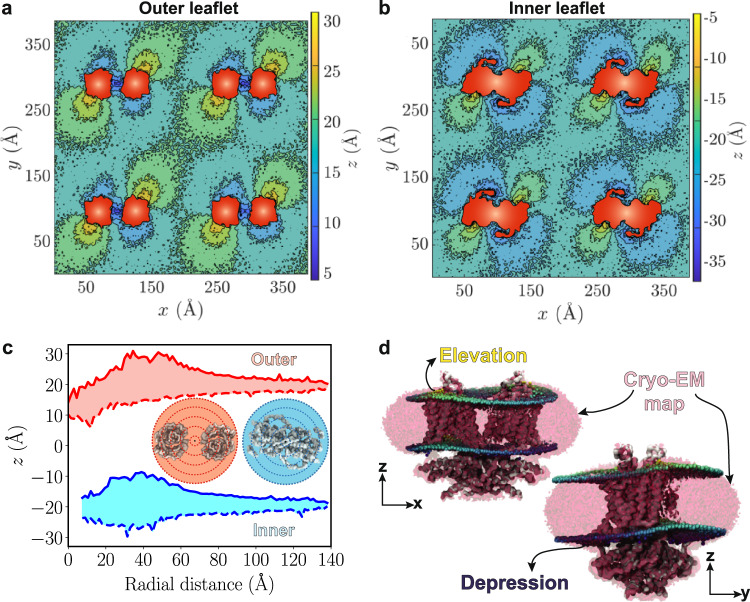
Fig. 2. Prestin-induced, anisotropic membrane deformation.
a and b 2D histograms of the z positions of lipid headgroups for outer and inner leaflets. Both leaflets are viewed from the extracellular side. Histograms are constructed from the last 5 μs of 20-μs trajectories. The cross-sectional areas of the prestin dimers in each leaflet are colored in red. c Range of z values of lipid headgroups in radial sections (drawn in the inset) around the protein, red for the outer and blue for the inner leaflet. The maximum elevation values are represented with solid and minimum values with dashed lines, whereas the range of observed z values is shown in light red and blue. The blue curves do not start from zero, since in the inner leaflet there are no lipids in that region. Source data are provided as a Source Data file. d Agreement between the lipid density in the cryo-EM map and the phospholipid distribution from the simulations, averaged over the last 5 μs of one of the trajectories. The cryo-EM density is represented as a red mesh. The coloring of headgroups is based on their z values, with highest and lowest z shown in yellow and blue, respectively. Elevated and depressed regions of the membrane form MD simulations overlap with corresponding areas in the cryo-EM map. For a rotating animation showing this comparison from different views, see Supplementary Movie 1.

