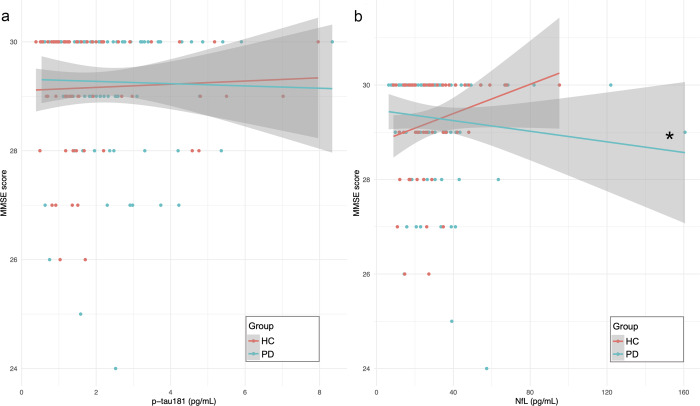
Fig. 2. Association of baseline MMSE scores with plasma p-tau181 and NfL concentrations.
Graphs representing MMSE score data points and regression lines in the PD group (blue line) and HC group (pink line) as function of plasma p-tau181 concentrations (a) and plasma NfL concentrations (b). *Significant linear regression model, with MMSE scores as dependent variables and plasma NfL as predictor, while adjusting for age, sex and years of education (Standardised β = 0.240, P = 0.027, overall regression model: R2 = 0.152, P = 0.002). MMSE Mini-Mental State Examination, PD Parkinson’s disease, HC healthy controls, pg/mL picograms per millilitre.

