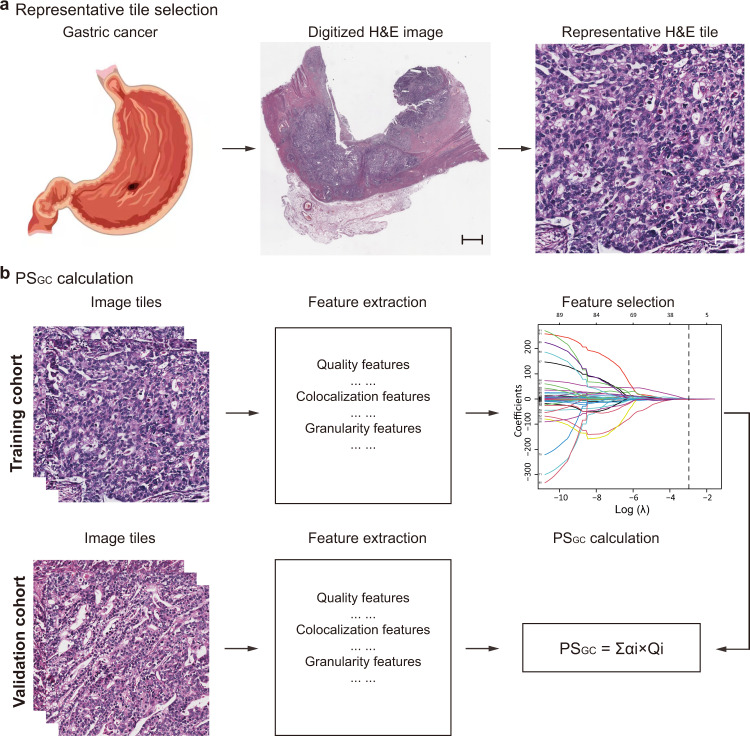
Fig. 1. Schematic illustration of PSGC construction.
a Selection of a representative H&E tile. The H&E-stained images of all included 480 patients are used, and 10 regions of interest with a field of view of 1000 × 1000 pixels per image containing the greatest number of tumour cells are randomly selected for analysis. One pixel is equal to 0.504 μm. Scale bars: 1500 and 50 μm, respectively. b Framework for constructing the PSGC. The pathomics features are extracted from the H&E-stained image tiles, and then the potential predictors are selected using a LASSO-Cox regression model in the training cohort with 264 patients. The PSGC is calculated via a linear combination of the selected features, and the PSGC for the validation cohort with 216 patients is directly calculated from the formula obtained in the training cohort. PSGC pathomics signature of gastric cancer, H&E haematoxylin and eosin, LASSO least absolute shrinkage and selection operator.

