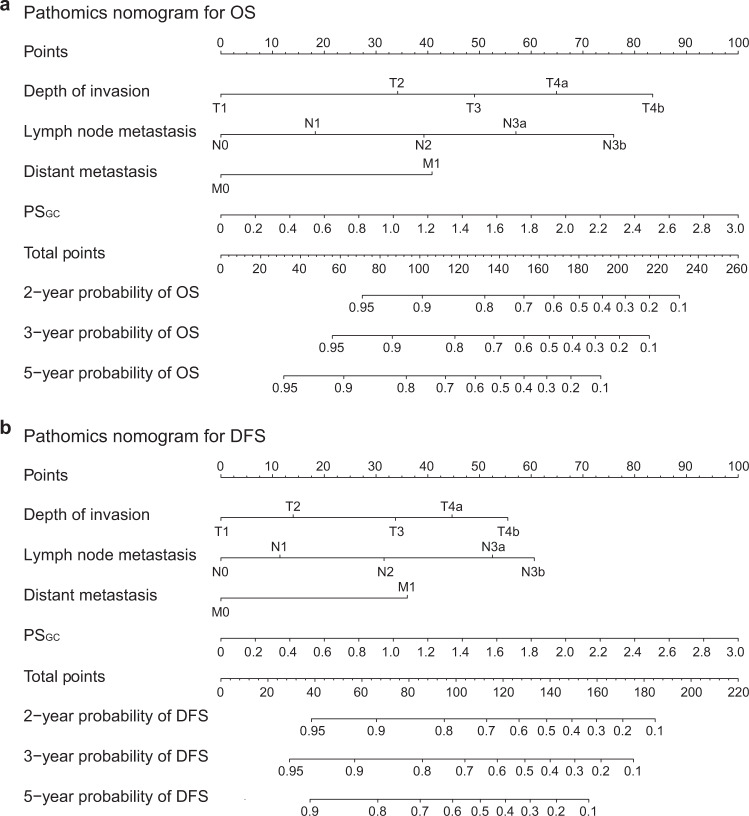
Fig. 3. Pathomics nomograms for the prediction of OS and DFS.
a Pathomics nomogram for OS. b Pathomics nomogram for DFS. The patient’s T stage on the depth of the invasion axis is first located using the nomogram. Then, a line is drawn straight upward to the Points axis to determine how many points the patient receives from the T stage. This process is repeated for each variable, and the points obtained from each risk factor are summed. Finally, the final sum is located on the Total point axis. A line is drawn straight down to find the patient’s probability of survival. OS overall survival, DFS disease-free survival, PSGC pathomics signature of gastric cancer. Source data are provided as a Source data file.

