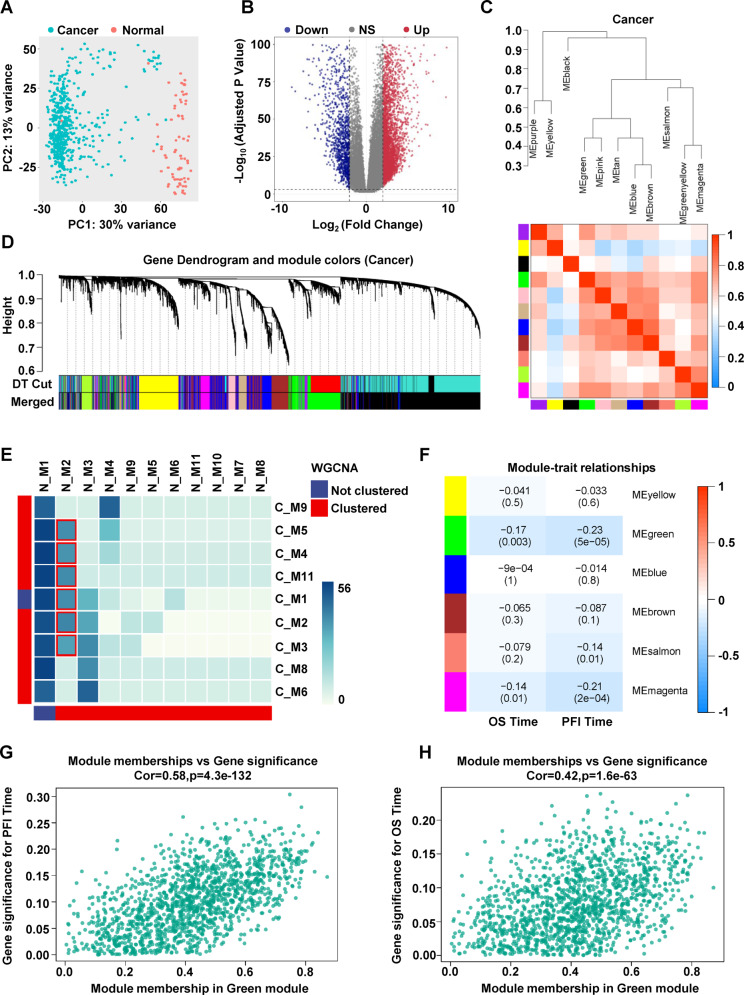
Fig. 1. Weighted gene co-expression network analysis.
A Principal component analysis of RCCC cancer group and normal groups. B Volcano plot of differentially expressed genes between cancer and normal groups. C According to the combination of module dissimilarity, 11 sub modules were finally obtained in the cancer group. D The correlation between cancer network modules. E Cross analysis of cancer module and normal module, color block represents the number of overlapping genes. F Heat map showing correlation between the gene module and clinical traits. G The relevance of module membership in green and gene significance for PFI time. H The relevance of module membership in green and gene significance for OS time.

