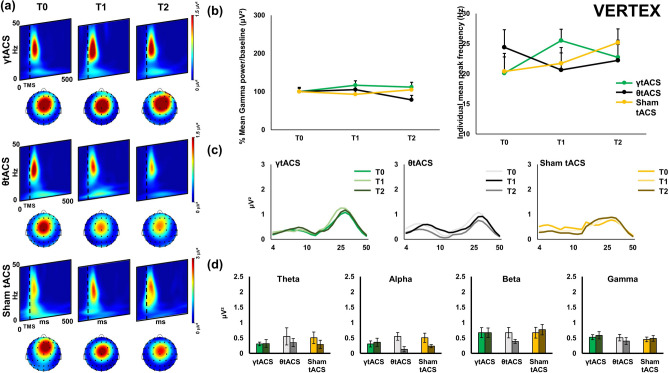
Figure 3.
Local transcranial magnetic stimulation (TMS)-evoked cortical oscillations of the Vertex. Panel (a) represents time–frequency oscillations for the three stimulation conditions and time points. Topographical maps depict the spatial cortical activation during TMS-EEG (50 ms after TMS pulse, 25 Hz). All maps and time–frequency representations were generated by BrainVision Analyzer (v 2.2; https://www.brainproducts.com/solutions/analyzer/). Panel (b) shows the power and shifting analysis performed on cortical oscillations. The panel represents on the left the % changes of the Gamma frequency in terms of power with respect to baseline. Moreover, the right side of the panel shows the shifting of the individual frequency in terms of Hz with respect to the three time points. Furthermore, panel (c) shows power expression of the whole frequency spectrum calculated for the cortical oscillations analysis. Lastly, panel (d) shows the four frequency bands considered for the analysis (Theta, Alpha, Beta, Gamma) and their change in power (μV2) during time (T0, T1, T2) for every stimulation condition.

