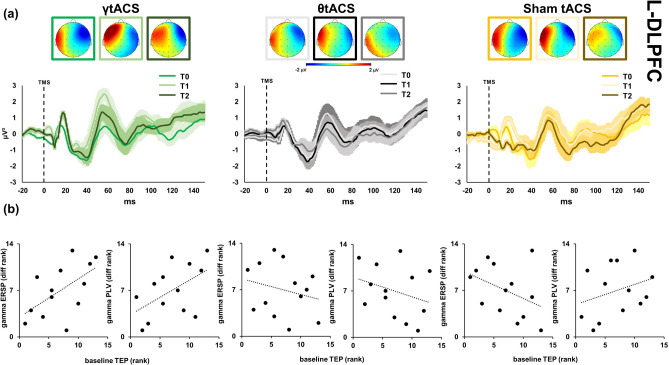
Figure 5.
Local transcranial magnetic stimulation (TMS)-evoked cortical response of left dorsolateral prefrontal cortex (l-DLPFC). Left side graphics depict TMS-evoked activity after iTBS–γtACS stimulation (green colours), centre graphics after iTBS–θtACS stimulation (black colours) and right side graphics after iTBS-sham tACS stimulation (yellow colours). Top maps (panel (a)) represent the topographic activity within the third calculated peak (from 48 to 65 ms; − 2 μV to 2 μV amplitude) in three times (from left to right respectively T0, T1, T2 time points). Furthermore, panel (a) shows TMS-EEG cortical response before (T0), right after (T1) and 20 min after stimulation (T2). All maps were generated by BrainVision Analyzer (v 2.2; https://www.brainproducts.com/solutions/analyzer/). Panel (b) depicts correlation graphics between the baseline TEPs amplitude, ERSP and PLV for the three tACS conditions.

