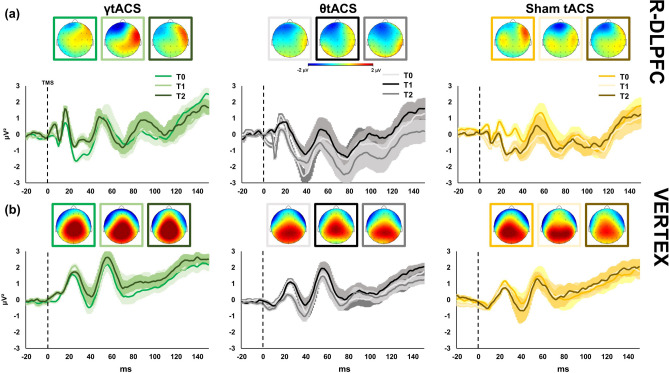
Figure 6.
Local transcranial magnetic stimulation (TMS)-evoked cortical response of left dorsolateral prefrontal cortex (l-DLPFC, panel (a)) and Vertex (panel (b)). Left side graphics depict TMS-evoked activity after iTBS–γtACS stimulation (green colours), centre graphics after iTBS–θtACS stimulation (black colours) and right side graphics after iTBS–sham tACS stimulation (yellow colours). Top maps (panel (a, b)) represent the topographic activity within the third calculated peak (from 48 to 65 ms; − 2 to 2 μV amplitude) in three times (from left to right respectively T0, T1, T2 time points). Panel (a, b) shows TMS-EEG cortical response before (T0) right after (T1) and 20 min after stimulation (T2). All maps were generated by BrainVision Analyzer (v 2.2; https://www.brainproducts.com/solutions/analyzer/).

