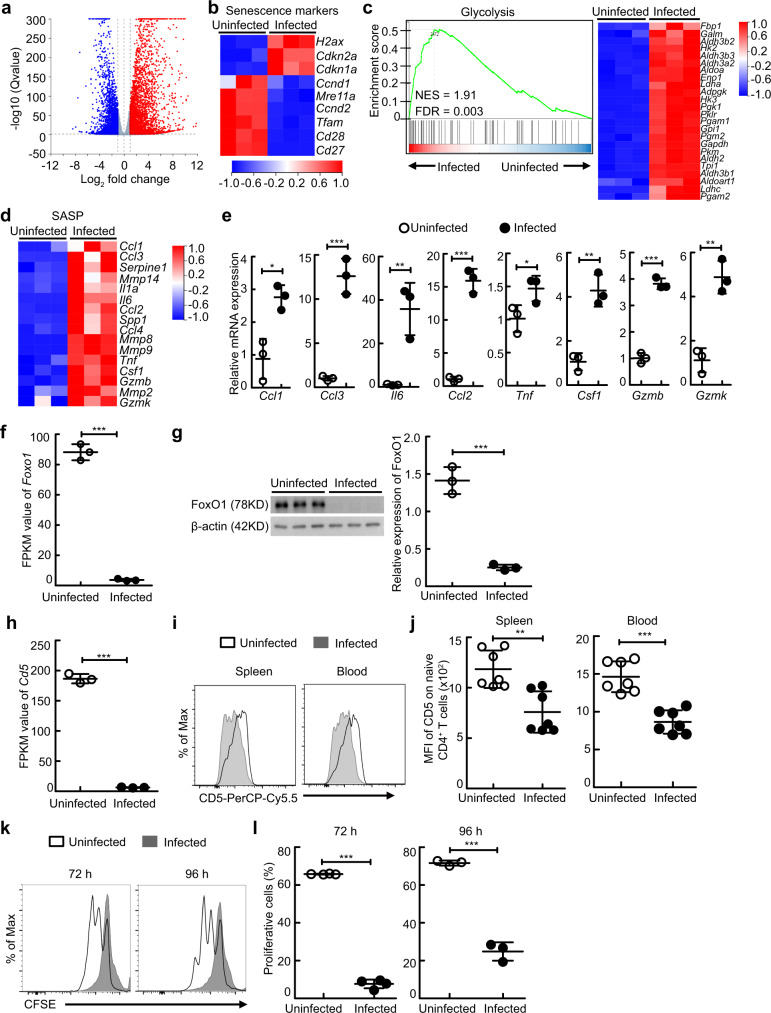
Fig. 1. Schistosome infection induces T cell aging in mice.
a–d, f, j Naive CD4+ T cells were sorted from uninfected or schistosome-infected mice (n = 3 mice) to perform RNA-seq analysis. a Volcano plot shows genes differentially expressed in naive CD4+ T cells. b Heat map shows the genes of senescence markers. c Gene set enrichment analysis (GSEA) of glycolysis pathway-associated genes in naive CD4+ T cells (left) and heat map of selected genes (right). d Heat map shows the genes of senescence-associated secretory phenotype (SASP). e Ccl1, Ccl3, Il6, Ccl2, Tnf, Csf1, Gzmb, and Gzmk gene expressions of naive CD4+ T cells were determined by RT-PCR (n = 3 mice). Ccl1, P = 0.0104; Ccl3, P = 0.0006; Il6, P = 0.0075; Ccl2, P = 0.0002; Tnf, P = 0.0481; Csf1, P = 0.0025; Gzmb, P < 0.0001; Gzmk, P = 0.0021. f FPKM value of Foxo1 gene of naive CD4+ T cells (n = 3 mice); P < 0.0001. g Representative and quantified western blots of FoxO1 in naive CD4+ T cells (n = 3 mice); P < 0.0001. h FPKM value of Cd5 gene of naive CD4+ T cells (n = 3 mice); P < 0.0001. i–l Cells were from uninfected mice or mice 8 weeks after schistosome infection. i, j Representative and quantified flow cytometry of the mean fluorescence intensity (MFI) of CD5 on naive CD4+ T cells from the spleen or peripheral blood (n = 7 mice, pool of two independent experiments); Spleen, P = 0.0016; Blood, P < 0.0001. k, l Representative and quantified flow cytometry of the CFSE MFI of CFSE-labeled naive CD4+ T cells from spleen stimulated with anti-CD3 and anti-CD28 antibodies for 72 or 96 h (n = 4 mice for 72 h; n = 3 mice for 96 h); 72 h or 96 h, P < 0.0001. All data are shown as the mean ± s.d. *P < 0.05, **P < 0.01, ***P < 0.001, Unpaired two-tailed Student’s t-test. Source data are provided as a Source Data file.

