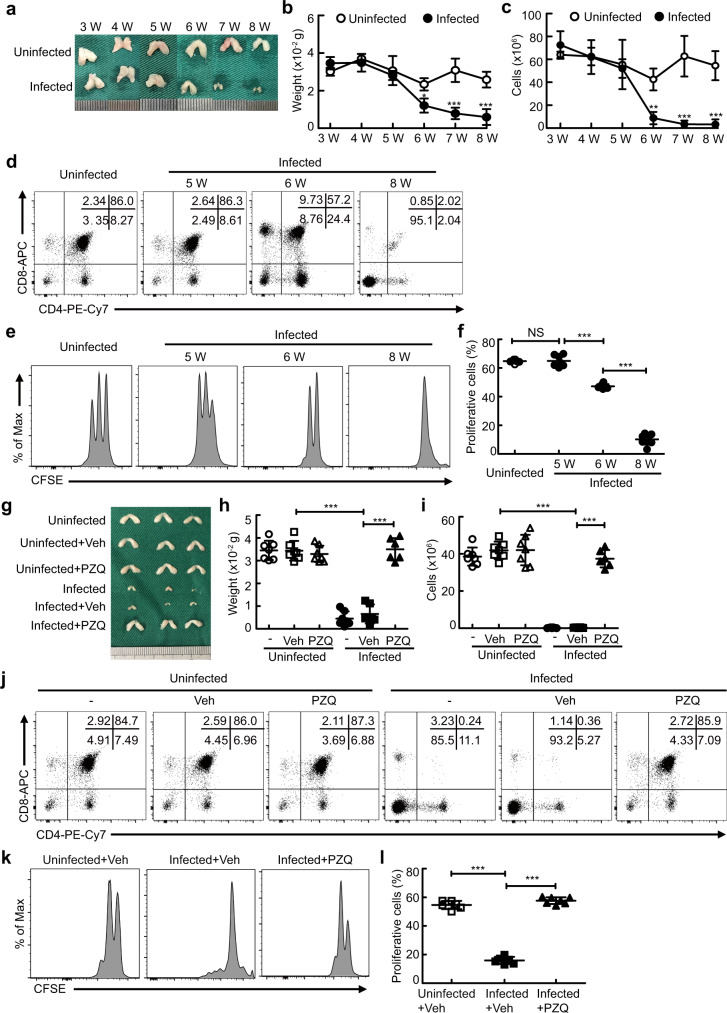
Fig. 2. Schistosome infection-induced thymic involution links to T cell aging in mice.
a–c Representative morphology and quantified weight and cellularity of thymus from uninfected mice or mice 3, 4, 5, 6, 7, or 8 weeks after infection (n = 4 mice). 6 W, P = 0.0265 (weight) or 0.0091 (cells); 7 W, P < 0.0001 (weight) or <0.0001 (cells); 8 W, P < 0.0001 (weight) or <0.0001 (cells); Two-way ANOVA with Tukey’s multiple comparisons. d Representative flow cytometry of thymocytes. e, f Representative and quantified flow cytometry of the CFSE MFI of naive CD4+ T cells stimulated with anti-CD3 and anti-CD28 antibodies (5 W, n = 7 mice; other groups, n = 8 mice; pool of two independent experiments). 5 W versus uninfected, P = 0.9995; 6 W versus 5 W, P < 0.0001; 8 W versus 6 W, P < 0.0001; One-way ANOVA with Tukey’s multiple comparisons. g–l Mice were treated with PZQ at week 8 after infection and sacrificed 7 weeks after PZQ treatment. g–i Representative morphology and quantified weight and cellularity of thymus (Infected+Veh or PZQ, n = 6 mice; Uninfected, Uninfected+Veh, Uninfected+PZQ, or Infected, n = 7 mice; pool of two independent experiments). Infected+Veh versus uninfected+Veh, P < 0.0001 (weight), P < 0.0001 (cells); Infected+PZQ versus Infected+Veh, P < 0.0001 (weight), P < 0.0001 (cells); One-way ANOVA with Tukey’s multiple comparisons. j Representative flow cytometry of thymocytes. k, l Representative and quantified flow cytometry of the CFSE MFI of CFSE-labeled naive CD4+ T cells stimulated with anti-CD3 and anti-CD28 antibodies (Uninfected+Veh or Infected+Veh, n = 6 mice; Infected+PZQ, n = 7 mice; pool of two independent experiments). Infected+Veh versus uninfected+Veh, P < 0.0001; Infected+PZQ versus Infected+Veh, P < 0.0001; One-way ANOVA with Tukey’s multiple comparisons. All data are shown as the mean ± s.d; *P < 0.05, **P < 0.01, ***P < 0.001, NS, not significant. Source data are provided as a Source Data file.

