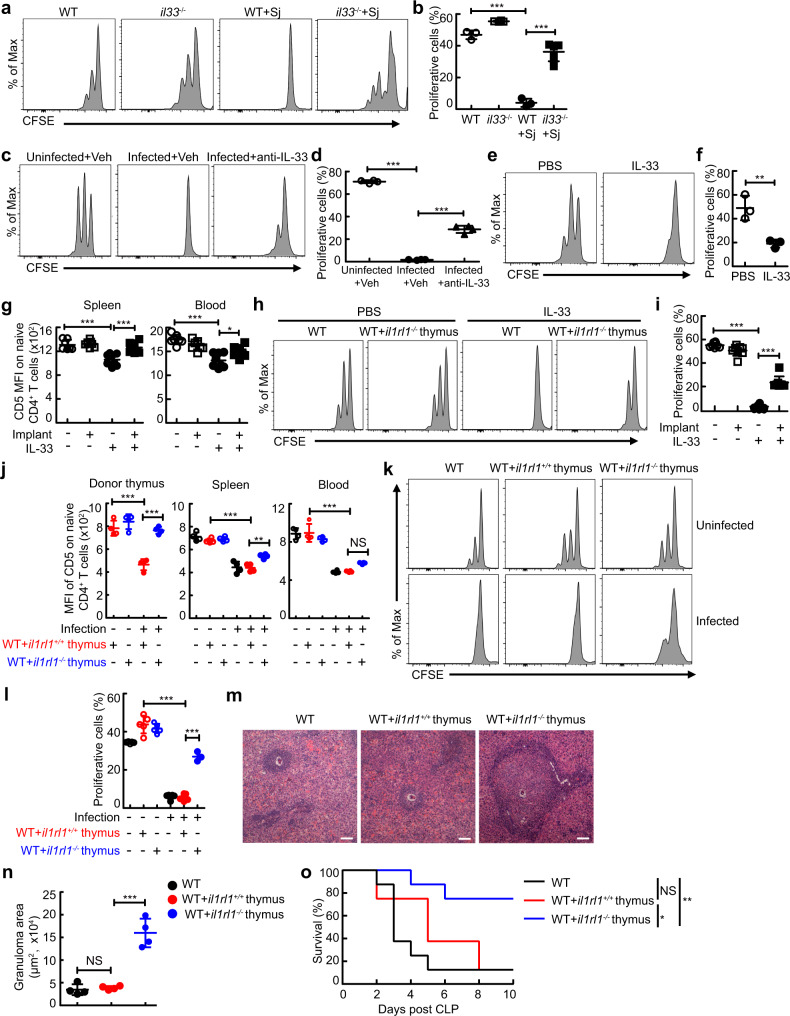
Fig. 4. Loss of IL-33-mediated thymic involution rescues effective T-cell immunity to control severe infection.
a, b CFSE MFI of naive CD4+ T cells from schistosome-infected mice (WT or WT + Sj, n = 3 mice; il33−/−, n = 4 mice; il33−/−+Sj, n = 5 mice), P < 0.0001. c, d CFSE MFI of naive CD4+ T cells from schistosome-infected mice treated with anti-IL-33 (n = 4 mice), P < 0.0001. e, f CFSE MFI of naive CD4+ T cells from mice treated with IL-33 (n = 3 mice). P = 0.0008, Unpaired two-tailed Student’s t-test. g–o Mice were transplanted with il1rl1+/+ or il1rl1−/− thymus. g CD5 MFI on naive CD4+ T (il1rl1−/−thymus+PBS, n = 7 mice; other groups, n = 8 mice; pool of two independent experiments). IL-33 versus PBS, P < 0.0001 (Spleen or Blood); il1rl1−/−thymus+IL-33 versus IL-33, P = 0.0003 (Spleen), P = 0.0205 (Blood). h, i CFSE MFI of naive CD4+ T cells (n = 8 mice, pool of two independent experiments), P < 0.0001. j CD5 MFI on naive CD4+ T (n = 4 mice). WT thymus+Infected versus WT thymus+Uninfected, P < 0.0001 (Donor thymus, Spleen, or Blood); il1rl1−/−thymus+Infected versus WT thymus+Infected, P < 0.0001 (Donor thymus), P = 0.0035 (Spleen), P = 0.0899 (Blood). k, l CFSE MFI of naive CD4+ T cells (il1rl1−/−thymus+Infected, n = 3 mice; other groups, n = 5 mice), P < 0.0001. m Representative image of histology of liver, Scale bar, 100 μm. n The areas of granulomas around a single egg (n = 4 mice). il1rl1+/+ thymus+Infected versus Infected or il1rl1−/− thymus+Infected, P = 0.9535 or P < 0.0001. o Survival curves of CLP-operated mice (n = 8 mice). WT + il1rl1+/+ thymus versus WT or WT + il1rl1−/− thymus, p = 0.3181 or P = 0.0205; WT + il1rl1−/− thymus versus WT, P = 0.0038; Log-rank (Mantel-Cox) test. All data are shown as the mean ± s.d. *P < 0.05, **P < 0.01, ***P < 0.001, NS, not significant. b, d, g, i, j, l, n One-way ANOVA with Tukey’s multiple comparisons. Source data are provided as a Source Data file.

