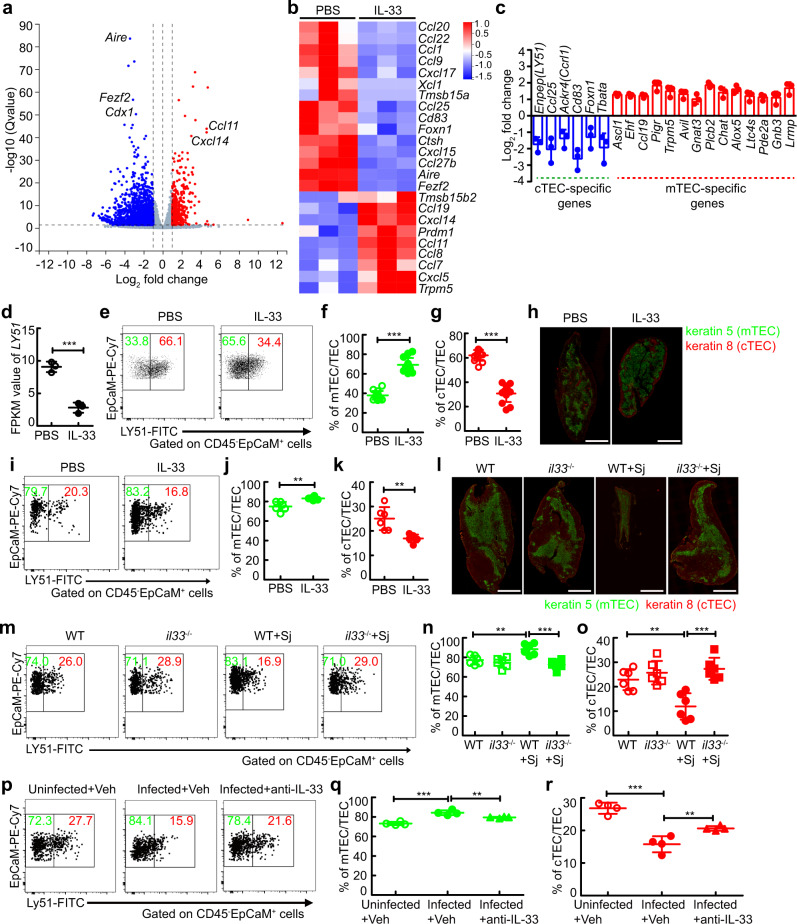
Fig. 5. IL-33 perturbs the function and compartment of thymic epithelial cells.
a–d TECs from thymus cultured in FTOC treated with IL-33 (n = 3 biologically independent samples of fetal thymic lobes) to perform RNA-seq analysis. a Volcano plot shows genes differentially expressed in TECs. b Heat map shows TEC function-associated genes. c cTEC or mTEC-specific genes. d FPKM value of Enpep gene (encoding LY51) of TECs (n = 3 biologically independent samples of fetal thymic lobes), P = 0.0006. e–g Representative and quantified flow cytometry of mTECs and cTECs from thymus cultured in FTOC treated with IL-33 (n = 13 biologically independent samples of fetal thymic lobes, pool of three independent experiments), P < 0.0001 (mTEC or cTEC). h Histology of the thymus from mice treated with IL-33 or PBS; Green, Keratin 5; Red, Keratin 8; Scale bar, 1000 μm. i–k Representative and quantified flow cytometry of cTECs or mTECs in the thymus from mice treated with IL-33 (n = 6 mice, pool of two independent experiments), P = 0.0025 (mTEC), P = 0.0025 (cTEC). l Histology of the thymus from WT or il33−/− mice 8 weeks after infection; Green, Keratin 5; red, Keratin 8; Scale bar, 1000 μm. m–o Representative and quantified flow cytometry of cTECs or mTECs in the thymus from WT or il33−/− mice 8 weeks after infection (n = 6 mice, pool of two independent experiments). WT + Sj versus WT, P = 0.0057 (mTEC), P = 0.0038 (cTEC); WT + Sj versus il33−/−+Sj, P = 0.0002 (mTEC), P = 0.0001 (cTEC). p–r Representative and quantified flow cytometry of cTECs or mTECs in the thymus from schistosome-infected mice treated with anti-IL-33 (n = 4 mice). Infected+Veh versus Uninfected+Veh, P < 0.0001 (mTEC), P < 0.0001 (cTEC); Infected+Veh versus Infected+anti-IL-33, P = 0.0099 (mTEC), P = 0.0099 (cTEC). All data are shown as the mean ± s.d. *P < 0.05, **P < 0.01, ***P < 0.001, NS, not significant. d, f, g, j, k Unpaired two-tailed Student’s t-test; n, o, q, r One-way ANOVA with Tukey’s multiple comparisons. Source data are provided as a Source Data file.

