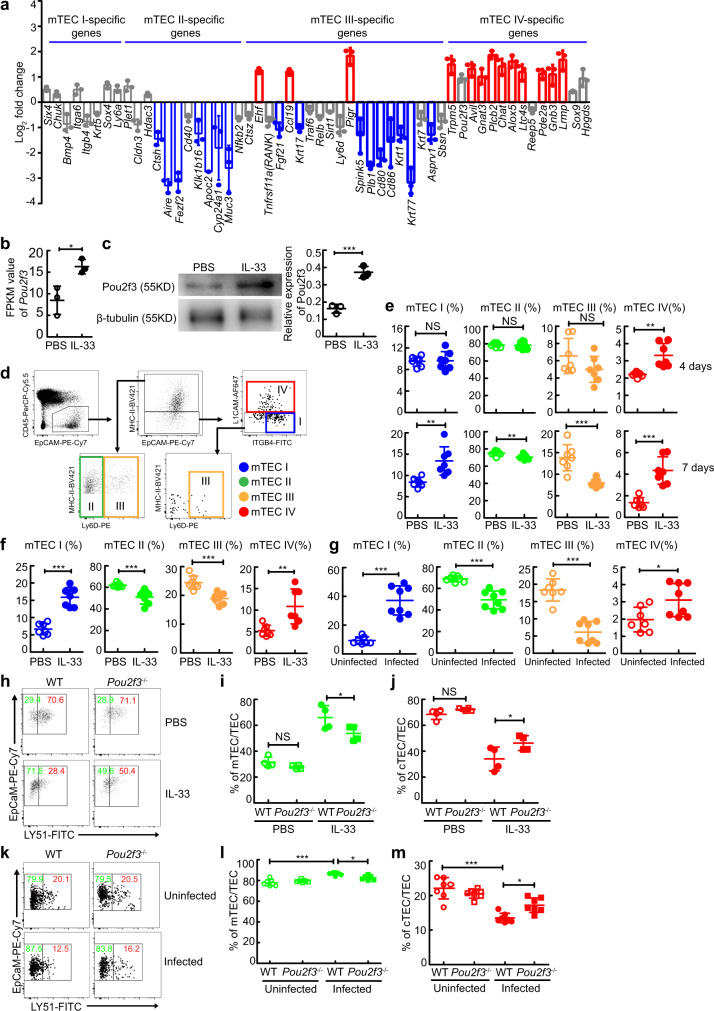
Fig. 7. IL-33 promotes the excessive generation of thymic tuft cells and acute thymic involution in a Pou2f3-dependent manner.
a RNA-seq analysis of mTEC subset-specific genes in TECs in FTOCs treated with IL-33. b FPKM values of Pou2f3 genes (n = 3 biologically independent samples of fetal thymic lobes), P = 0.0212. c Representative and quantified western blots of Pou2f3 in TECs in FTOCs treated with IL-33 for 4 days (n = 3 biologically independent samples of fetal thymic lobes), P = 0.001. d Gating strategy of mTEC subsets. e mTEC subset percentages in FTOCs treated with IL-33 for 4 days or 7 days (n = 7 biologically independent samples of fetal thymic lobes, pool of two independent experiments). 4 days or 7 days, P = 0.886 or 0.0027 (mTEC I), P = 0.7789 or 0.0094 (mTEC II), P = 0.1266 or 0.0004 (mTEC III), P = 0.0013 or <0.0001 (mTEC IV). f, g mTEC subset percentages in IL-33-treated or schistosome-infected mice (Infected, n = 8 mice, other groups, n = 7 mice, pool of two independent experiments). IL-33 versus PBS or Infected versus Uninfected, P < 0.0001 or <0.0001 (mTEC I), P = 0.0008 or P < 0.0001 (mTEC II), P = 0.0004 or <0.0001 (mTEC III), P = 0.0043 or 0.0238 (mTEC IV). h–j The percentages of mTECs or cTECs in FTOCs treated with IL-33 for 4 days (n = 4 biologically independent samples of fetal thymic lobes). PBS, P = 0.7988 (mTEC or cTEC); IL-33, P = 0.0474 (mTEC or cTEC). k–m The percentages of cTECs or mTECs in schistosome-infected mice (n = 7 mice, pool of two independent experiments). Infected WT versus Uninfected WT or Infected pou2f3−/−, P < 0.0001 (mTEC or cTEC) or P = 0.0146 (mTEC or cTEC). b, c, e, f, g Unpaired two-tailed Student’s t-test; (i, j, l, m) One-way ANOVA with Tukey’s multiple comparisons. All data are shown as the mean ± s.d. *P < 0.05, **P < 0.01, ***P < 0.001, NS, not significant. Source data are provided as a Source Data file.

