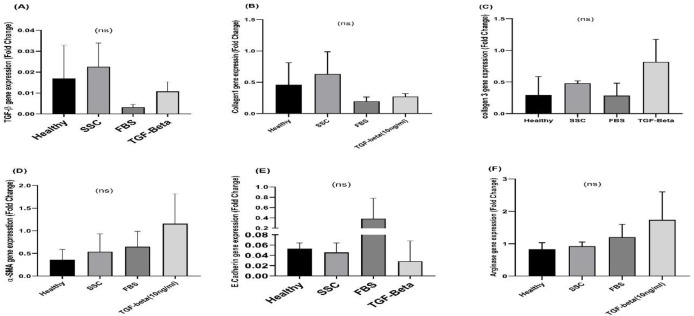
Fig. 2.
The mRNA expression levels of fibrosis-associated genes among cultured cells exposed to four treatments. The differences in the mRNA expression levels of fibrosis-associated genes in fibroblasts, cultured with serum from healthy controls, serum from SSC patients, FBS alone and human TGFβ1 (10 ng/mL) + FBS, are demonstrated. A: TGFβ; B: Collagen I; C: Collagen III; D: α-SMA; E: E-cadherin; F: Arginase. Results are presented as mean ± SEM. Data were analyzed using the nonparametric Kruskal-Wallis test with Dunn-Bonferroni post hoc testing. NS: not statistically significant

