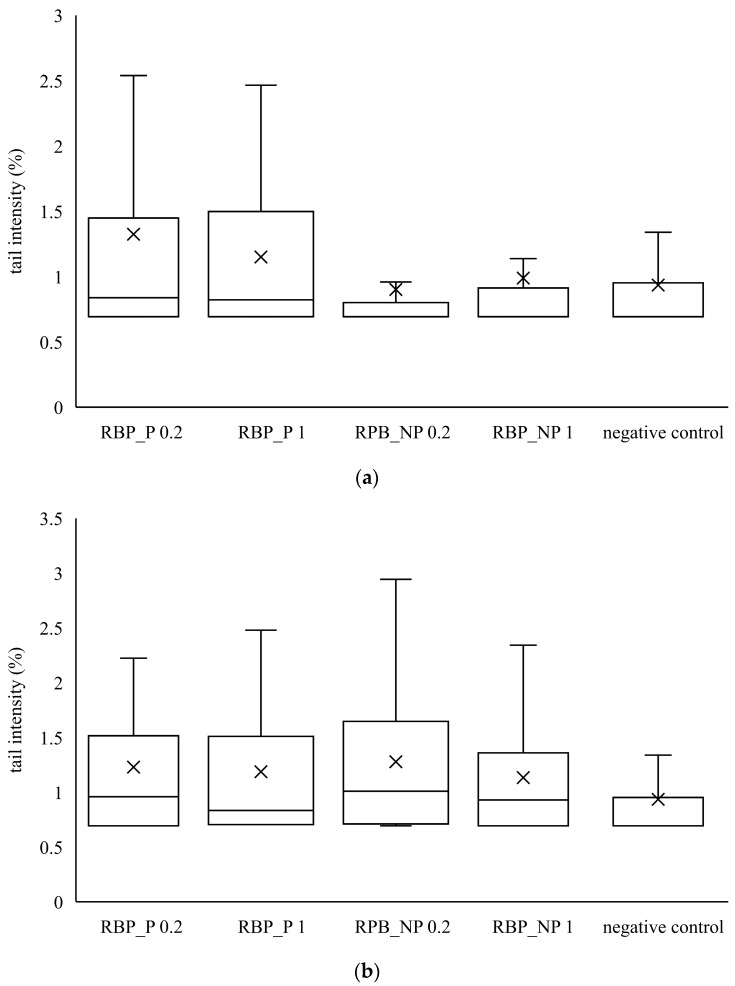
Figure 4.
Genotoxic effect of red beetroot peel extract on (a) CaCo2 cells and (b) HepG2 cells. A box and whisker plot summary of a set of tail intensity data obtained in 100 comets. X represents the mean value of tail intensity, the bottom line is the minimum, the middle line represents the median value of tail intensity, and the area above the median line is the third quartile of the tail intensity data. The upper whisker is the maximum value measured by the comet assay. RBP_P-red beetroot peel extract with polysaccharides; RBP_NP-red beetroot peel extract without polysaccharides, concentrations 0.2 and 1 mg mL−1.

